

Water Bankruptcy: The 70% of Our Aquifers Now in Decline
How seventy percent of the world’s great aquifers came to be in decline, why Lake Mead hit its all-time record low three days ago, and what happens in Somalia, in Iran, in the Dry Corridor of Guatemala, and in the Imperial Valley of California when the water that grows a family’s food runs out from under them.
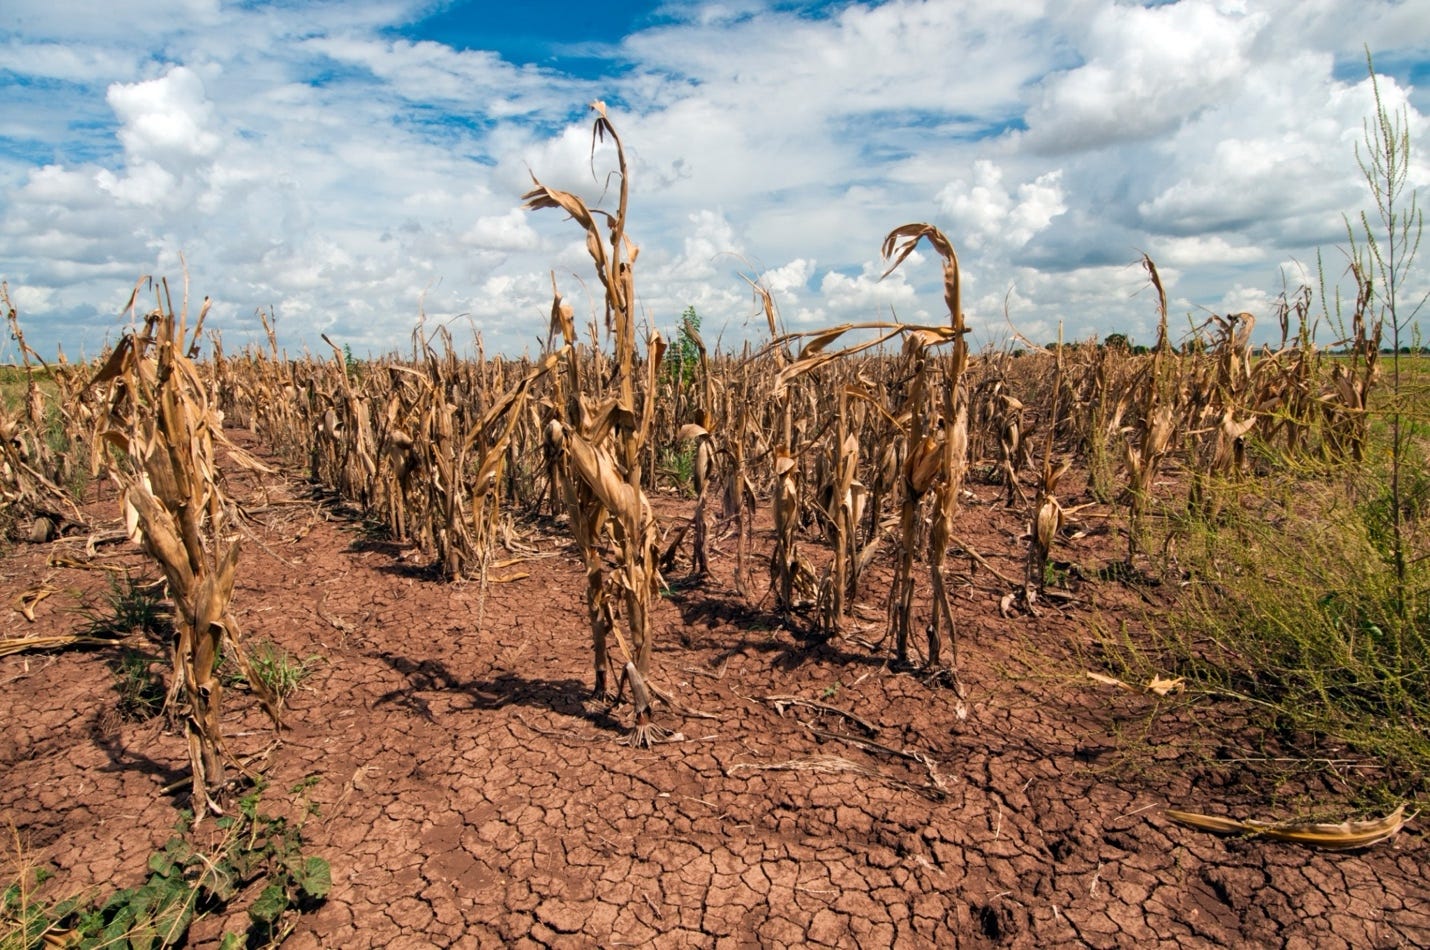
By USDA photo by Bob Nichols - https://www.usda.gov/media/blog/2014/02/11/southern-plains-climate-hub-seeks-address-three-huge-problems, Public Domain, https://commons.wikimedia.org/w/index.php?curid=89060994
The Ledger Nobody Kept
At some point between midnight and one in the morning on Friday, August 7, 2026, the surface of Lake Mead fell to 1,040.46 feet above sea level. It was the lowest the reservoir has stood since it was filled behind Hoover Dam in the 1930s, breaking the previous record set on July 28, 2022 by a margin that Reclamation puts at four one-hundredths of a foot and some wire reports put at a tenth. Either way it is a matter of inches, which is the sort of margin that makes a milestone easy to dismiss.¹ By Saturday morning, Lake Mead held only 7.0 million acre-feet against its capacity to hold 26.1 million acre-feet: That is only 26.8 percent full. Lake Powell, upstream, stood at 22.8 percent full. Federal forecasters expect Mead to set a new low record in nearly every month from here through 2028. Those projections do not yet account for the mandatory federal cuts now expected to be imposed on the states by the Interior Department.²
On July 31, the Interior Department published the framework that will govern the Colorado River for the next decade: up to three million acre-feet of mandatory reductions must be made in water use, reductions falling entirely on Arizona, California and Nevada. These cuts will be imposed by the Secretary of the Interior after the seven basin states failed to produce an agreement of their own.³ What those reductions do to the food supply is the subject of a later section. What they mean here is simpler. The decline of the largest reservoir in the United States has stopped being only a hydrological question and become an allocation question, about which farms lose water, and about who decides.
This is a matter of Western water politics and of food. It is also a matter of who gets to stay where they were born and who will be forced to move due to no water.
Six months earlier, in January, the United Nations University’s water institute published an assessment of the world’s water reserves that put the American Southwest in a context most Americans never see. Its title is Global Water Bankruptcy, and the accounting was blunt: seventy percent of the world’s major aquifers are in long-term decline. A broader test than the rate thresholds used in the peer-reviewed work discussed below, and a lower bar, but a bar that seven aquifers in ten now fail. More than forty percent of the water used for irrigation on Earth now comes out of aquifers that are being steadily drained. Three billion people live in places where total water storage, both surface and subsurface together is falling, and more than half of global food production is concentrated in exactly those places. Some 170 million hectares of irrigated cropland, an area larger than France, Spain, Germany and Italy combined, sits under high or very high water stress.⁴
That is the ledger. It has been running a deficit for decades, and almost no country keeps an honest publicly available record of aquifer water levels.
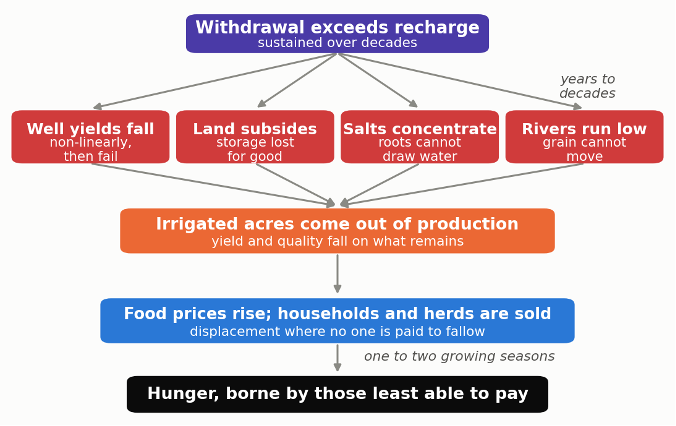
Figure 1. One shortage, four separate failures, one destination. Unlike a drought, aquifer depletion does not end. It works through four independent channels at once, each of which alone can take land out of production, and it arrives at the same place a season or two later. The compensation step is what separates the American case from the Somali one: where farmers are paid to fallow, the displacement does not occur.
4Hunger.org has spent this year documenting three shocks to the world’s food supply in sequence: the fertilizer supply collapse that followed the closure of the Strait of Hormuz in February (see Fertilizer Famine); the two-year American drought that drove the U.S. cattle herd to its smallest size since 1951 and the wheat crop to a 22 percent year-over-year collapse (see Parched Ground); and the record El Niño now building in the Pacific (see Scorched Harvest)⁵. Each of those is an event. Each has a start date, a peak, and a plausible end.
This article is about the thing underneath all of them, which is not an event at all. It is a slow, compounding, almost entirely invisible drawdown of the water the world’s food supply is built upon, and there is no foreseeable end to the draining of these water resources, because there is no end to the needs for water that are overusing these water reserves. An El Niño passes. A strait reopens. An aquifer that has been pumped past its recharge rate for sixty years does not recover in a good year, or in a good decade, or in some cases there is nothing at all that will enable the aquifer to recharge and rebound.
“A drought takes a harvest. A depleted aquifer takes the farm, and then the whole town, and then the option of ever farming in the region again.”
A Map of What Is Already Gone
In 2024, a team led by Scott Jasechko published in Nature what remains the most comprehensive picture of global groundwater ever assembled: roughly 170,000 monitoring wells across 1,693 aquifer systems in more than forty countries, covering about three-quarters of the world’s groundwater withdrawals. Thirty-six percent of those aquifer systems are declining faster than 0.1 meters a year. Twelve percent are falling faster than half a meter a year. In thirty percent of them, the rate of decline in 2000–2022 was faster than it had been in 1980–2000, an acceleration of water withdrawal more than twice as common as chance would produce.⁶
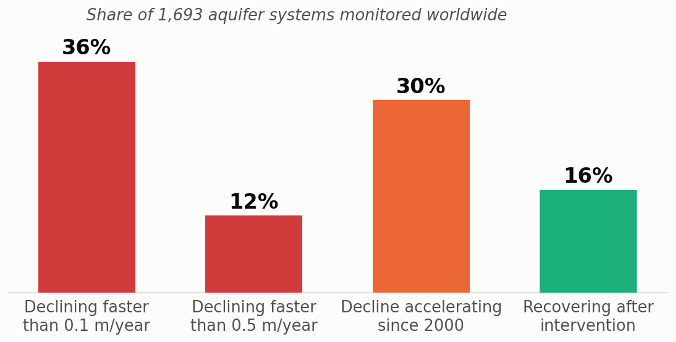
Figure 2. The state of the world’s groundwater. Of 1,693 aquifer systems monitored across more than forty countries, roughly a third are falling faster than 0.1 metres a year, and in thirty percent the decline has accelerated since 2000. The sixteen percent that are recovering did so after deliberate intervention, not on their own. Shares from Jasechko et al., Nature, 2024.
The geography of the decline identified maps almost perfectly onto the geography of the world’s grain.
In the United States, the High Plains Aquifer, the Ogallala aquifer, underlies 111.8 million acres across eight states and supplies roughly thirty percent of all groundwater used for irrigation in the country.⁷ The USGS puts the area-weighted decline from predevelopment to 2019 at 16.5 feet, which sounds survivable until the number is disaggregated by state. Texas has lost 44.1 feet. Kansas has lost 27.3. Nebraska has lost four-tenths of a foot.⁸ That single table explains why there is no unified Ogallala aquifer politics: the states with the water have no reason to accept limits, and the states without it are past the point where limits will help. In the Texas High Plains Water District, average saturated thickness in the Ogallala is now 51 feet.⁹ A 2020 study projected that twenty-four percent of currently irrigated High Plains land will be unable to support irrigation by 2100. In a detail that earlier work missed was that most of the acres that lose irrigation will fall back to dryland farming with crops that can grow on rainfall alone, with food production at roughly a third of that of irrigated yields, Unfortunately, what the study also found was that not all of the farmland will be able to support even dryland farming. On thirteen percent of the transitioning land the soil is too thin to raise a rainfed crop at all, and it will go back to grazing. Irrigation, on that ground, was never improving the soil. It was substituting for good soil and allowing crops to grow there that would ever have on the poor soil alone.¹⁰
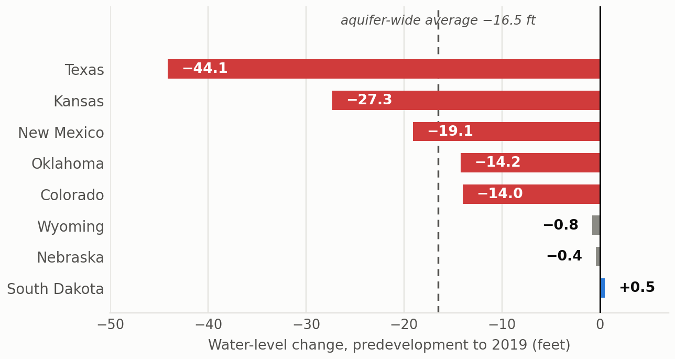
Figure 3. One aquifer, eight political realities. Water-level change in the High Plains aquifer from predevelopment to 2019. Texas has lost more than a hundred times what Nebraska has, and South Dakota has gained. This distribution is why there is no unified Ogallala politics: the states with water have no reason to accept limits, and the states without it are past the point where limits would help. Figures from USGS Scientific Investigations Report 2023-5143, Table 2.
In India, the Central Ground Water Board’s 2025 assessment found 730 of the country’s 6,762 groundwater assessment units classified as over-exploited. Punjab, the state that fed the Green Revolution, is now extracting 26.27 billion cubic meters a year when the sustainable removal from the aquifer is only 16.80 billion cubic meters, an extraction of 156 percent of the replenishable removal. In 111 of Punjab’s 153 blocks, more water leaves the ground each year than enters it. In Sangrur district the figure is a removal of 310 percent of the replenishable removal.¹¹ Both of these signal aquifers being overused and which will be depleted over time.
In Iran, where agriculture consumes roughly ninety percent of all available water, groundwater extraction has caused land subsidence across 31,400 square kilometers. Almost two percent of the country’s land surface is sinking faster than a centimeter a year, with more than a hundred sites exceeding that rate and one area near Rafsanjan dropping 34 centimeters annually. Subsidence is what happens when unconsolidated aquifer systems containing significant layers of fine-grained, compressible materials like clay and silt, aquitards, lose the pore water that helps carry the weight of everything above them: the grains pack together, the layers thin, the ground surface drops, and the space that once held water closes and does not reopen.¹² Seventy-seven percent of that fast subsidence correlates with where Iran’s most productive agriculture occurs. Most of it is, in the authors of the report’s framing, “irrecoverable”: inelastic compaction accounts for at least sixty percent of the deformation, which means the pore space of the aquifer which holds the water collapses and much of the aquifer’s capacity to hold water again is permanently lost.¹³
In Afghanistan, the Kabul aquifer has dropped 25 to 30 meters in a decade, with extraction exceeding recharge by 44 million cubic meters a year. Nearly half the city’s wells are already dry.¹⁴
There is one genuine counter-example. On the North China Plain, where water tables were falling one to two meters a year, By 2008 the plain had pumped away roughly 60 cubic kilometers of groundwater more than the rain put back: about 48 million acre-feet, or two and a half years of everything the entire Colorado River basin consumes.
China then went at the problem from both ends at once. It brought new water in, and it forced less water out. The new water came through the South-to-North Water Diversion, a canal system built to carry 9.5 cubic kilometers a year north from a reservoir on the Han River. In 2023 it actually delivered roughly 4.3 million acre-feet, and about fourteen percent of everything the region used that year. The reduction came from enforced limits on pumping, which cut what farms, factories and cities drew out of the ground by around 12 cubic kilometers a year. That is close to 10 million acre-feet: a single year’s saving roughly half the size of the entire Colorado River’s annual consumption.
Together they produced something no one had documented at this scale: the water tables rose about 0.7 meters a year across 130,000 square kilometers, an area the size of Louisiana, between 2020 and 2024, By 2024 the water in the aquifer stood higher than it had in 2005.¹⁵ Aquifer depletion, in other words, is not a law of physics. It is a policy outcome. It can be reversed by policy, at enormous cost, where a state decides to as long as the soils have not collapsed.
The Ground Gives Way, But It Does Not Shake
One question follows naturally from all of this, and it is worth answering plainly, because the answer is usually gotten backwards: does draining an aquifer cause earthquakes?
Very largely, no, and the physics runs opposite to the intuition. Pumping water out of rock lowers the pressure in its pores, and lower pore pressure presses the two sides of a fault together more firmly rather than loosening them. Whatever destabilizing effect exists arrives indirectly, as the drained rock contracts and transfers stress to its neighbors, and as the crust flexes upward once the weight of the water is gone.¹⁶
Scale settles it. Groundwater withdrawal changes crustal stress by something on the order of one to fifteen kilopascals. An earthquake releases a thousand to ten thousand. Research published this year found groundwater cycles in northern California associated with as much as a ten percent modulation in the rate of small earthquakes, and noted, in the same breath, that ocean and earth tides of equivalent strength produce no such effect at all.¹⁷ In the global database of human-induced earthquakes, groundwater extraction accounts for under one percent of the 1,377 recorded cases; hydraulic fracturing, mining and reservoir impoundment account for most of the rest.¹⁸ The most heavily monitored test of the mechanism is the Groningen gas field in the Netherlands, where pore pressure fell by more than ten times what the most exhausted aquifer experiences, and the largest earthquake in fifty years was magnitude 3.6.
None of this describes injection, which is a different process with a different record. Pumping fluid into the ground raises pore pressure and unclamps faults, and it took Oklahoma from one or two magnitude-3 earthquakes a year before 2009 to 888 in 2015, including a magnitude 5.8. The two are routinely confused, and they are opposites.¹⁹
What depletion does to the ground is not seismic, and it is not in dispute. The ground sinks. More than eighty percent of documented land subsidence in the United States is a consequence of groundwater use, across more than seventeen thousand square miles in forty-five states, and Arizona has mapped a hundred and sixty-nine miles of earth fissures opening above emptied basins. These are not earthquakes. They are the slow and permanent collapse of the space the water used to occupy, the more consequential hazard, and the one from which there is no recovery.
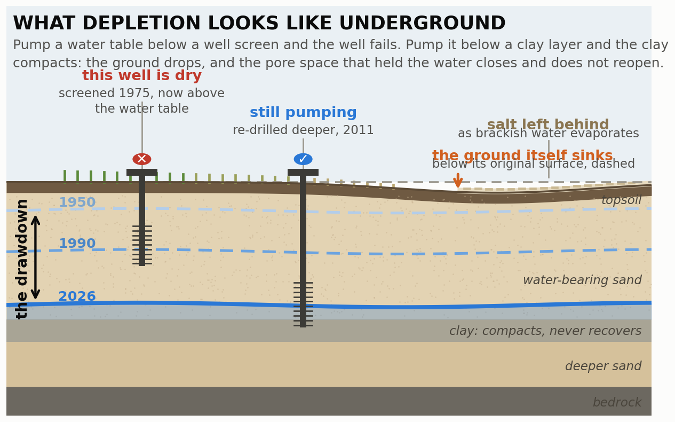
Figure 4. What depletion looks like underground. Pumping lowers the water table decade by decade; when it falls below a well’s screen the well fails, and when it falls below a clay layer the clay compacts, the ground surface drops, and the pore space that held the water closes permanently. Salt concentrates at the surface as the water that remains gets more brackish. Schematic, drawn to the mechanisms described in this article; vertical scale is exaggerated.
Three Ways a Water Shortage Kills a Harvest
One: not enough water at the one moment that matters
A crop does not need water evenly through the duration of its growth. It desperately needs abundant water at two or three specific points, and a deficit that arrives during flowering or during grain fill does damage that later rains cannot undo. Wheat builds its pollen about a week before it flowers, in a stage botanists call the young microspore, and this is the thirstiest moment in the plant’s life. Developing pollen grains cannot feed themselves; they are supplied with sugar from the leaves. A plant short of water closes its pores to stop losing moisture, which also shuts down photosynthesis, which starves the anthers, the small sacs at the tip of the stamen where pollen is made. The pollen still forms. It simply forms sterile.
What follows is a failure that conceals itself. The plant does not die. It has water enough to stay green, put up a head, and flower on schedule. But nothing is fertilized, no grain sets, and the crop stands in the field looking like a crop until the combine goes through and finds husks. Rain the following week changes nothing. The pollen died during the dry days, and a plant cannot make it twice.
Grain filling is the second window, and it fails in a different currency. Once a kernel has been fertilized, the plant spends roughly a month pumping starch into it, drawing on two accounts: the sugar its leaves are making now, and the sugar it banked earlier in the stem. Drought closes both. The pores shut, photosynthesis falls away, and the plant, reading the shortage as the end of its season, begins shutting down early, drying its leaves and halting the deposit before the kernel is full. Nothing is missing from the head this time. Everything in it is simply too small. And because a dry spell usually arrives with heat, the two stresses stack: high temperatures shorten the filling period on their own, even where there is water enough. The farmer learns the result at the elevator, where shriveled grain and low-test weight are docked once on the scale and again on the price. Between them, these two windows account for most of what a dry year actually costs. One sets how many grains a field will carry. The other sets what each of them weighs. Rain in between is welcome. Rain after either is too late.²⁰
In a controlled Chinese trial on two winter wheat cultivars, drought imposed at that single stage cut viable grain number on the main stem by 51.8 percent in the drought-tolerant variety and 79.5 percent in the sensitive one.²¹ The field still looked like a wheat field. But, it was not one because the plants held no wheat.
This is why “flash droughts,” the rapid-onset soil moisture collapse driven by heat and wind rather than by a long rainfall deficit, has become an important new term of art. Global projections show flash drought frequency rising through the century, and the cropland-specific numbers are the ones that matter here: under a high-emissions pathway, the annual risk of flash drought on North American cropland rises from 32 percent in 2015 to 49 percent by 2100; European cropland from 32 percent to 53 percent; African cropland from 35 percent to 47 percent.²²
The best current modeling of what this does to the food supply is a study published in Nature Communications this year. Run through 2050 under a middle-of-the-road emissions scenario, drought reduces globally averaged production of maize, rice, soybean and wheat by somewhere between roughly 0.2 percent and just under 2 percent. That is a small number, but the story is in the distribution. Maximum country-level production losses exceed 10 percent in 62 countries and exceed 20 percent in 24 countries, with single-crop maxima reaching 76 percent for maize, 67 percent for rice and 64 percent for wheat.²³ A global food system can absorb a two percent average. It cannot absorb a 76 percent maize failure in a particular country that eats its own maize and has no foreign exchange to import someone else’s.
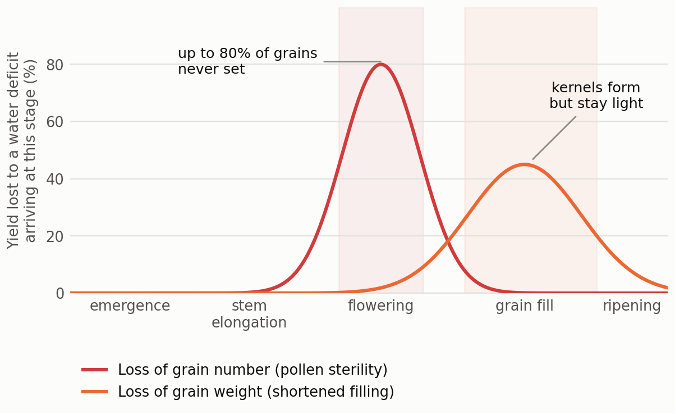
Figure 5. Two windows, two currencies. A water deficit does the most damage at two specific moments, and it damages the crop differently at each. Stress at flowering sterilizes pollen and removes grains that never form; stress during grain fill leaves the grains in place but light. Rain between the two windows helps; rain after either does not. The curves are illustrative of the two sensitivity windows, anchored to measured grain-number losses of 51.8 and 79.5 percent in controlled winter-wheat trials.
Two: the wrong kind of water
A. Salty
When fresh water runs short, farmers do not stop irrigating. They irrigate with what is left, brackish groundwater, drainage water, recycled wastewater, and in hot climates the evaporation concentrates the salts that come with it. The result is a slow poisoning that is invisible until it is permanent and kills the crop.
The mechanism is worth understanding, because it explains why the damage is so hard to undo.
A root does not pump. It has no muscle for drawing water out of soil. It relies on osmosis: water moves on its own from where dissolved salts are dilute toward where they are concentrated, and because the sap inside a root is saltier than the water in ordinary soil, water flows inward without the plant spending anything to move it. That gradient is the entire engine.
Salt in the soil weakens that gradient, and enough of it reverses the direction. When the water around the roots becomes as salty as the sap inside them, water stops entering the plant altogether. When it becomes saltier still, water begins moving the other way, and the soil draws moisture back out of the root. The soil is visibly damp. The plant is in drought. It dies of thirst standing in wet ground.²⁴
What does get in causes a second kind of harm. Sodium and chloride accumulate in the leaves and scorch them, and they crowd out the potassium and nitrate the plant needs, so a salt-stressed crop is starved as well as parched.
And here is the trap. Every irrigation adds a little salt, and evaporation removes pure water while leaving that salt behind, so concentration climbs season after season. The only way to reverse it is to flood the field with enough clean water to carry the salt down below the root zone. The cure for salinity is water in abundance, which is precisely what a farmer who has resorted to brackish water does not have.²⁵
In December 2024, the FAO published the first global assessment of salt-affected soils in fifty years. 1,381 million hectares, 10.7 percent of the Earth’s land area, are salt-affected, with roughly another billion hectares at risk. Ten percent of irrigated cropland and ten percent of rainfed cropland are already affected. Under current warming trajectories the affected share of the global land surface could reach between 24 to 32 percent by the end of the century. In the worst-hit regions, salinity stress costs up to seventy percent of yield in crops like rice and beans. Ten countries, Afghanistan, Argentina, Australia, China, Iran, Kazakhstan, Russia, Sudan, the United States and Uzbekistan, hold seventy percent of the world’s salt-affected soil.²⁶ The most-cited estimate of the annual global cost of salt-induced degradation in irrigated areas is $27.3 billion in lost crop production. That figure is more than a decade old, counts nothing but forgone yield, and has never been replaced; FAO’s 2024 global assessment, the first in fifty years, did not attempt one. What has been measured since is the loss in food rather than in money. The World Bank puts the annual production lost to water salinity at 124 trillion kilocalories, enough to feed more than 170 million people every day. That the best current accounting of salinization is denominated in calories rather than dollars is itself a finding about how seriously the problem has been costed.²⁷
B. The Water That Carries Something Else
Salinity is the slow failure, and it is at least visible in the yield. There is a second failure that never appears in production statistics at all, because it does not damage the crop. It damages the people who grow it and the people who eat it.
When a city runs short of fresh water, the one supply that remains reliably available to the farms on its edge is the water the city has already used. Roughly 29 million hectares of the world’s irrigated land, about a tenth of the total, is watered from sources carrying a substantial load of urban wastewater, and about 95 percent of that is untreated or inadequately treated. Formal, engineered reuse of properly treated effluent covers perhaps 1.5 million hectares. The ratio of unsafe to safe is around thirty to one.²⁸
The reason is cost, and the pattern is exactly what you would guess. Of the 267.5 billion cubic meters of municipal wastewater the world produced in 2023, 45 percent was discharged with no treatment whatsoever. High-income countries treat 91.5 percent of theirs. Low-income countries treat 5.8 percent.²⁹
What that water carries is not hypothetical. In Kumasi, Ghana, farmers irrigating with wastewater carried Ascaris infection were 15.8 percent against 6.0 percent in a matched control group, about four times the odds.³⁰ In Santiago, Chile, where 13,500 hectares of salad crops were irrigated with raw sewage, typhoid ran at 210 cases per 100,000 at its peak, and when cholera arrived in 1991, 68 percent of the first 41 cases had eaten raw wastewater-irrigated salad. Chile banned the practice. That is the encouraging half of the story: this is a solved problem wherever anyone decides to follow the solution, do not water food crops with sewage.³¹
The residue is more permanent than the pathogens. In Mexico’s Mezquital Valley, irrigated with Mexico City’s untreated sewage for roughly a century, soil chromium now runs 7.7 to 8.6 times background and cadmium 3.0 to 4.7 times. Antibiotic-resistance genes in those soils are two orders of magnitude more abundant than in comparable fields.³²
Treated wastewater reuse is not a hazard; it is one of the best adaptations available for making due with the limited water resources that we have. Israel reuses about 87 percent of its treated effluent, supplying roughly half its agricultural water. Even the untreated kind carries real value, the nutrients in it are worth $179 to $451 per hectare per year, are taken up more efficiently than synthetic fertilizer, and after forty years leave soil carbon half again higher. When Mexico built a treatment plant that stripped those nutrients out, Mezquital farmers protested, and on the economics they were not wrong. The problem is not that poor farmers use wastewater. It is that they are made to use it raw and untreated.³³
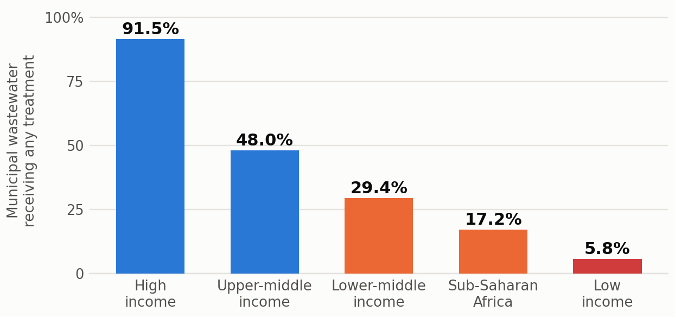
Figure 5. Who treats their sewage before it reaches a field. Share of municipal wastewater receiving any treatment, 2023. The farms most likely to be irrigating with untreated waste are in the countries least able to treat it, which is why the hazard falls almost entirely on the poor. Figures from Qadir, Drechsel and Jones, Discover Water, 2025.
Three: not enough water to move the harvest
Even a crop that survives the water risk in the field has to get to a port. In the United States it usually gets there by water, and for four consecutive autumns it has struggled to make this trip.
The USDA’s modal share analysis finds, is that barges carried 44 percent of U.S. grain exports in 2022, 48 percent of all corn, 48 percent of all soybeans, and 32 percent of all wheat.³⁴ That is still close to half of the corn and soybeans this country sells to the world, moving on a river whose depth is now a recurring emergency.
The Mississippi at Memphis set a modern record low of 10.81 feet below normal in October 2022, then broke it at 11.52 feet below normal in October 2023. During the 2023 episode, loading drafts between Cairo, Illinois and the Gulf were cut by an average of 24 percent, tow sizes by 17 to 38 percent, and barge freight rates exceeded 900 percent of tariff, more than nine times the normal baseline rate due to a severe shortage of available barge capacity.³⁵ Low water returned in 2024 and again in 2025, when the Ohio River was contributing just eight percent of Lower Mississippi flow against a typical fifty percent due to a massive flash drought, and southbound grain shipments on the river fell 79 percent in little more than a month with corn movements down 72 percent.³⁶
What a low river actually does to a farmer is measurable to the penny. Peer-reviewed work on the 2022 event found that with the Mississippi gauge at −5 feet, soybean basis fell 58 cents a bushel for farms within five miles of the river, 29 cents at ten miles, and 12 cents at twenty-five.³⁷ The grain is fine. The farmer simply gets less for it, because the only affordable way out of the country has narrowed.
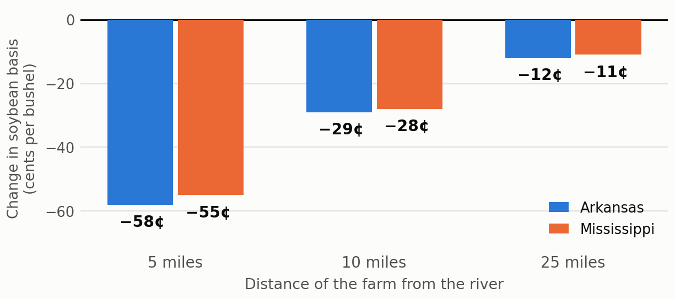
Figure 6. What a river gauge does to a farmer’s cheque. With the Mississippi five feet below normal, the discount on soybeans deepens the closer a farm sits to the river, because the farms nearest the water are the ones with no alternative to it. The grain is unaffected; only its price is. Measured for the 2022 low-water episode by Mitchell and Biram, Applied Economic Perspectives and Policy, 2025.
As of the week ending August 1, 2026, before harvest, before the seasonal low-water window, barge rates at St. Louis were running at 638 percent of tariff, up 39 percent from a year ago. Cairo-to-Memphis rates were up 47 percent.³⁸ The river has not yet made news this year. The price of using it already has.
The Water in the American Basket
Nearly half the contiguous United States, 48.5 percent, was in moderate drought or worse as of August 4, up from 29.9 percent a year earlier.³⁹ The commodity-specific numbers are worse than the map: 50 percent of the winter wheat crop, 58 percent of spring wheat, 57 percent of alfalfa hay, and 49 percent of the national cattle herd are in drought.⁴⁰ USDA’s July estimate put the 2026 wheat crop at 1.536 billion bushels, down 22.6 percent year over year on 5.1 million fewer harvested acres.⁴¹ Corn conditions stand twelve points below last year.⁴² The January cattle inventory of 86.2 million head was the smallest in seventy-five years.⁴³
Against that, the Colorado River. The basin supports 40 million people, seven states and thirty tribal nations, and its natural flow has fallen so far below the volume the 1922 Compact divided that the arithmetic no longer works: inflows averaged 12.9 million acre-feet a year between 2000 and 2024 compared to the baseline of 18 million acre-foot.⁴⁴ Agriculture takes 52 percent of all consumption in the basin and 74 percent of direct human consumption; alfalfa and grass hay alone account for 46 percent of all direct water consumption, and cattle-feed crops for 62 percent of agricultural water.⁴⁵ The Colorado River, in other words, is mostly used to feed livestock.
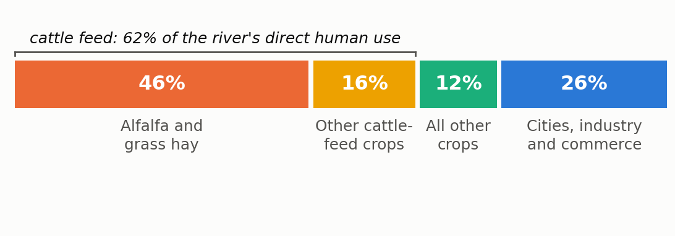
Figure 7. What the Colorado River actually grows. Feed for cattle takes 62 percent of the river’s direct human use, and a single crop, alfalfa and grass hay, takes 46 percent, nearly twice what every city, factory and business in the basin uses combined. Shares from Richter et al., Communications Earth and Environment, 2024; percentages are of direct human consumption and exclude reservoir evaporation and riparian use.
The seven basin states were given until February 14, 2026 to agree on how to operate the river after the 2007 interim guidelines expired. They failed. The decision therefore passed to the Interior Secretary, and on July 31 the Bureau of Reclamation published its final plan.
It is not a fixed rulebook. Rather than setting operating rules for a decade, it sets a procedure that is rerun every two years between 2027 and 2036, adjusting to how much water is actually in the system. Two numbers do most of the work. The first is how much water Glen Canyon Dam will release from Lake Powell into the lower river each year, which can now be set anywhere between 5.0 and 12.0 million acre-feet depending on how full Powell is in the autumn. The second is how much the states below it must give up: shortages of up to 3.0 million acre-feet.
Where that shortage falls is the fault line. All of it falls on the Lower Basin, Arizona, California and Nevada, and all of it is mandatory. The four Upper Basin states are asked for up to 200,000 acre-feet, and their contribution is voluntary.⁴⁶
The plan is candid about how the water will be found: by paying farmers and irrigation districts to leave fields dry. Combined Lower Basin reductions could eventually reach 3.6 million acre-feet a year: roughly forty percent of what those three states are entitled to draw from the river.⁴⁷
Within the Lower Basin’s share, roughly sixty percent falls on Arizona, thirty-five percent on California and four percent on Nevada.⁴⁸ And the authority behind it is worth being precise about, because these cuts are not the product of a negotiation. The Secretary of the Interior has served as water master of the Lower Colorado since the Boulder Canyon Project Act of 1928 and the Supreme Court’s decree in Arizona v. California, and may set operating rules without the states’ consent when the states cannot agree among themselves. Running underneath this is an older and more mechanical process that is already in force: each August, Reclamation’s 24-Month Study projects Lake Mead’s January elevation and thereby sets the shortage tier that automatically reduces deliveries to Arizona, Nevada and Mexico the following year.⁴⁹ No Record of Decision has yet been signed, which means the post-2026 framework remains a preferred alternative rather than law. Arizona’s water agency has called it “unacceptable,” warning that the reductions “would devastate Arizona’s water users and its economy,” while the Upper Basin governors said they were “encouraged.” Litigation is the widely expected next step.
Two facts about what that water grows. Yuma, Arizona supplies 80 to 90 percent of America’s leafy greens in the winter months. The Imperial Valley, which holds the single largest entitlement on the river, roughly 97 percent of it going to agriculture: produces about two-thirds of the vegetables Americans eat between November and March.⁵⁰ Imperial County’s unemployment rate is around 19 percent, and roughly one job in six there is in agriculture.⁵¹
California’s own groundwater reckoning is running on a parallel track. Two San Joaquin Valley subbasins are under state probation, with pumpers facing $300 per well and $20 per acre-foot; the Public Policy Institute of California projects that between 500,000 and 900,000 acres of valley farmland will come out of production by 2040 depending on how well the state manages the transition, with the worst case costing roughly 50,000 jobs and $4.5 billion in regional GDP.⁵² And the physical consequence of a century of overdraft is already eating the infrastructure built to fix it: the San Joaquin Valley sank an average of nearly an inch a year between 2006 and 2022, a 33-mile stretch of the Friant-Kern Canal lost up to sixty percent of its carrying capacity to subsidence, and after $325 million and eight years spent rebuilding ten miles of it, the ground beneath the new concrete has already dropped another foot: taking back 250 cubic feet per second of the capacity the project restored.⁵³
None of this stays in the West. USDA now forecasts beef and veal prices up 10.7 percent in 2026 and fresh vegetables up 6.8 percent, against 3.1 percent for food overall.⁵⁴ Those are precisely the two categories most exposed to water: beef through a seventy-five-year-low herd with half of it standing in drought, and fresh vegetables through a river that hit its all-time record low last Friday. A collapse in egg prices is currently masking both in the headline index.
And this arrives at American households with less protection than they had a year ago. The 2024 Household Food Security report, published in December 2025, found 13.7 percent of U.S. households, nearly 48 million people, in food-insecure homes, including more than 14 million children.⁵⁵ It was the last such report the government will publish; USDA announced in September 2025 that it was discontinuing a thirty-year annual series, and the Census supplement that fed it was cancelled the same month.⁵⁶ Independent surveys already put the number far higher: the Urban Institute found that nearly one in four American adults, 24.2 percent, lived in a food-insecure household in 2025, and more than one in four working-age adults.⁵⁷ Both figures are defensible; they measure the same condition with different survey machinery, and they disagree by a factor of nearly two. The instrument that would have settled which is closer to the truth no longer exists. Meanwhile the SNAP provisions of the 2025 reconciliation law begin to bite: on October 1, 2026, seven weeks from now, states must absorb 75 percent of SNAP administrative costs, with a share of benefit costs following in 2027, against roughly $200 billion in program reductions over a decade.⁵⁸
“The federal government stopped measuring hunger in the same year it enacted the largest cut to food assistance in the program’s history. You cannot be held accountable for a number that no longer exists.”
The People Who Move, and the People Who Cannot
Water scarcity does not usually produce a photograph. It produces a decision, made at a kitchen table, one household at a time, and the person who makes it is almost never recorded as a climate migrant⁵⁹.
The strongest global evidence is a 2024 study in Nature Climate Change that examined 107,840 migration flows between subnational regions across 72 countries from 1960 to 2016 and found that drought and aridity significantly increase internal migration, most strongly in arid zones, and most strongly of all in rural, agriculture-dependent areas. Within countries, people move from poorer regions to wealthier ones.⁶⁰ The mechanism is not that water disappears. It is that a livelihood does.
For Central America, the link runs through a specific and well-documented channel. A 2023 study in Scientific Reports matched 323,579 people apprehended in family units at the U.S.--Mexico border between 2012 and 2018 against growing-season moisture in the 54 departments of El Salvador, Guatemala and Honduras they came from. Departments that had recently experienced drier-than-average growing seasons sent 70.7 percent more emigrants to the United States. The authors are careful, and so are we: across model specifications, the effect ranged from 8.9 percent to 257 percent, and apprehension data cannot confirm that the households who lost crops are the same people who arrived at the border.⁶¹ But the direction is not seriously in dispute, and the corroborating evidence is strong: when coffee leaf rust destroyed an average of 71 percent of production for affected smallholders in eastern Guatemala, household migration roughly doubled, including in communities with no prior migration tradition.⁶²
In Somalia, the accounting is more direct than almost anywhere. Nearly 62,000 people were displaced by drought between the start of 2026 and April, and three of every four new displacements in Somalia are now drought-related, a 22 percent year-over-year increase, with a further 125,000 projected by mid-year if conditions held.⁶³ The southern Deyr cereal harvest came in 83 percent below its thirty-year average. Some 6.5 million Somalis are projected in crisis-level food insecurity or worse by March, including two million in emergency conditions and 1.84 million acutely malnourished children.⁶⁴
In Iraq, the migration tracking network has recorded 28,379 families, 170,274 people, displaced by drought between 2016 and 2024 across twelve central and southern governorates.⁶⁵ In Iran, the vice president for rural development said in January that of the country’s 69,000 villages, 31,000 now stand deserted, and that a nation which was 70 percent rural in 1976 has inverted entirely.⁶⁶ That figure is cumulative over five decades and water is one cause among several, but it arrives alongside reservoir declines exceeding 70 percent at two of Tehran’s principal sources, and a president who has said publicly that parts of the capital may have to be evacuated and the seat of government relocated.⁶⁷
The most-quoted number in this field is the World Bank’s projection of 216 million internal climate migrants by 2050 across six world regions, with water scarcity explicitly modeled as a driver.⁶⁸ It is worth knowing exactly what that number is: it is the high end of a 44-to-216-million range, produced under a pessimistic scenario combining high emissions with unequal development, published in 2021 and not updated since. The European Commission’s own research service now cautions that migration forecasts of this kind “are indicative at best” and recommends assessing populations’ exposure to climate extremes rather than predicting migrant counts.⁶⁹
What This Publication Cannot Tell You
Advocacy journalism earns its authority by being the first to name its own weak points. Four of them here are load-bearing.
First: drought displacement is systematically undercounted, and we cannot tell you by how much. The Internal Displacement Monitoring Centre, the world’s authoritative counter, only began recording drought as a displacement trigger in 2017. Its 2026 report notes that fewer drought movements were recorded in the Horn of Africa and southern Africa last year, “but that was partly the result of reduced reporting,” and that Iraq’s drought displacement figure fell to a third of the prior year’s “in part the result of less reporting.”⁷⁰ Sudden-onset disasters generate evacuation orders and camp registrations. Drought generates a family that sells its goats, then its tools, then leaves, and gets recorded, if at all, as an economic migrant. A causal analysis of Somalia from 2016 to 2023 found that market food prices, not rainfall, were the dominant proximate driver of movement, which is precisely why the connection to water gets lost in the record.⁷¹
Second: drought is not the leading driver of global hunger, and we will not claim it is. The Global Report on Food Crises for 2026 found 266 million people in 47 countries at crisis-level acute food insecurity or worse. Conflict was the primary driver for 147.4 million of them; extreme weather for 87.5 million, and the weather-driven figure fell year over year.⁷² Every famine the IPC has classified in this decade, Sudan in 2024 and 2025, Gaza in 2025, has been driven by war, not by rain. Water scarcity is a multiplier and a slow strangler. It is not the main killer, and a movement that overstates it will be correctly discredited.
Third: the most famous case in this literature does not hold up as it is usually told. The claim that Syria’s 2006–2010 drought displaced 1.5 million people who then triggered a civil war is the standard example in climate-security writing. The drought was real and was the worst in the instrumental record. But the 1.5 million figure was traced by later researchers to a single official’s remark in a humanitarian news report, most likely describing people affected by rather than displaced by drought; UN and Syrian government estimates put actual drought-related migration at 40,000 to 60,000 families, four to twelve percent of Syria’s urban growth over the period.⁷³ Satellite analysis subsequently showed Syrian croplands recovering quickly after 2009, with only 0.5 percent of previously cultivated land permanently abandoned.⁷⁴ The original authors have since revised their language from “displaced” to “affected” and describe climate as one contributing factor among many.⁷⁵ We cite the drought. We do not cite the war.
Fourth, and most uncomfortable: the poorest people do not migrate. A study of 115 countries across four decades found that in middle-income countries, warming increased both urbanization and emigration, but in poor countries, higher temperatures reduced the probability of migrating, both to cities and abroad, consistent with severe liquidity constraints.⁷⁶ The relationship between climate stress and movement is an inverted U. Above a wealth threshold, a shock mobilizes people. Below it, a shock immobilizes them. The people in the very worst trouble are the ones you will never see at a border, and a systematic review of dryland mobility research found that of 183 empirical studies, only ten addressed involuntary immobility at all.⁷⁷
This has a mirror image inside the United States that ought to be said plainly. American irrigators facing Colorado River cuts are being paid to fallow: hundreds of dollars an acre-foot, funded federally.⁷⁸ There is no evidence of population collapse in Colorado River farming counties, and we will not invent it. What the American case actually demonstrates is that a rich country can buy its way out of the displacement that a poor country has to live through. That is a more damning fact than a depopulation statistic would have been, and it is true.
“The question is never whether a society can survive losing its water. It is whether that society can afford to be paid for losing it.”
The Window That Is Still Open
Groundwater is the slowest-moving crisis in the food system, which means it is also the one where action taken this year still changes the outcome. Four things are required.
First, treat water accounting as food security infrastructure. The most recent aquifer-wide USGS assessment of the Ogallala reports water levels as of 2019. Anyone citing “the latest federal data” on the aquifer that irrigates the American grain belt is citing measurements seven years old. Meanwhile USDA has terminated the thirty-year household food security series.⁷⁹ A country that intends to manage a resource has to measure it: fund the USGS groundwater monitoring network, restore the food security survey, and require the states drawing on interstate aquifers to publish annual, well-level data.
Second, pay for demand reduction before the well fails, not after. The foundational Kansas projection found that cutting groundwater use twenty percent today would extend the region’s peak agricultural production into the 2070s and yield more cumulative output beyond 2070 than continuing at current rates.⁸⁰ Kansas’s Local Enhanced Management Areas have already demonstrated the mechanism at small scale: one district cut applied water per acre by 34 percent primarily by reducing water intensity rather than idling acres, and the Greater GMD4 LEMA is in renewal hearings right now, with the next order due for the 2028–2032 term.⁸¹ Conservation is not a sacrifice of production. On the arithmetic, it is the only path that preserves production.
Third, make anticipatory financing the default for slow-onset water crises. Somalia’s 2026 displacement was forecast months before it happened; the Deyr harvest failure was visible in satellite data before the harvest. Anticipatory action: cash, seed, drought-tolerant inputs and pre-positioned food released on forecast triggers rather than on famine declarations: costs a fraction of late emergency response. It requires a humanitarian budget that exists. The U.S. contribution has fallen from roughly $14 billion to $3.7 billion in a single year, and no trigger system survives the removal of the money behind it.⁸²
Fourth, protect the domestic floor while the price wave arrives. Beef at nearly eleven percent and fresh vegetables at nearly seven percent are water prices, arriving in American grocery stores through the Colorado River and the drought map. The SNAP cost-shifts that begin on October 1 will transfer part of that cost onto state budgets and, from 2027, onto the households least able to carry it.⁸³ A Farm Bill built for volatility: insurance and disaster programs that reach diversified operations and pay in the season the loss occurs, not two years later: is the other half of the same obligation.
How to Watch It Come
Every figure in this article came from a public dataset. If you want to watch the water yourself:
· The American drought, weekly: the U.S. Drought Monitor updates every Thursday; NIDIS’s drought.gov carries current conditions and the Mississippi River dashboard.
· The Colorado River, daily: Reclamation publishes Lower Colorado reservoir levels every day and the 24-Month Study monthly; the post-2026 process page holds the Final EIS.
· The aquifers: USGS groundwater monitoring; the Kansas Geological Survey annual water-level measurements; India’s Central Ground Water Board assessments.
· The crops and the freight: USDA’s Crop Progress, the monthly WASDE, the weekly Grain Transportation Report, and the GEOGLAM Crop Monitor.
· The hunger and the displacement: FEWS NET, IPC, WFP’s HungerMap Live, and IDMC’s Global Internal Displacement Database.
A Ledger That Comes Due
Water is the only input in agriculture with no substitute. A farmer who cannot afford fertilizer grows a smaller crop. A farmer who cannot afford diesel harvests late. A farmer with no water grows nothing, and no amount of capital, technology or policy will change that arithmetic.
For most of the last seventy years the world has hidden that fact from itself by borrowing. It pumped aquifers faster than rain could refill them, built cities and export industries on the difference, and recorded the resulting harvests as productivity rather than as debt. Seventy percent of the world’s major aquifers are now in decline. The lake behind Hoover Dam is one-quarter full. The wheat belt of the southern Plains is farming on fifty feet of saturated sand. Punjab is pumping half again more groundwater each year than its aquifers can sustainably yield.
The people who will pay are not the people who spent it. The pastoralist in Somalia whose Deyr harvest came in 83 percent short did not drain an aquifer. The Guatemalan smallholder whose growing season failed did not build a diversion canal. The mother in Phoenix looking at the price of ground beef, and the farmworker in the Imperial Valley whose employer has just been paid to leave a field dry, did not sign the 1922 Compact. But all of them are standing downstream of the same ledger, and it is coming due in the currency it always comes due in: skipped meals, sold livestock, mounting debt, a decision made at a kitchen table about whether to stay.
What makes this crisis different from a drought or a strait or an El Niño is that it does not surprise anyone. Aquifer decline is measured in monitoring wells, published in federal reports, and projected decades in advance. There will be no moment at which the world can say it did not know. There is only the question of whether the people who hold the water rights, write the farm bills, fund the humanitarian budgets and set the pumping limits will act while acting is still cheap.
Call your representatives, in your statehouse and in Washington. Ask them three questions: what is being done to measure the aquifer your food comes from, what is being done to reduce the draw on it before the wells fail, and what happens to the families who cannot afford to leave when they do. Then ask them again in October, when the SNAP cost-shift takes effect, and again in January, when the Colorado River framework begins. The water is being spent now. So is the time.
An excellent and timely article on a very real crisis that is unfolding. I also cannot stress enough how important it is to monitor wells in a timely manner so that decentralized policies such as the LEMAs in Kansas could be implemented through community mobilization. Metering wells is a dire need in over-critical aquifers like the Ogallala. Kansas does this through the publicly available WIMAS dataset (which is also a rich panel dataset that's a blessing to economists working on the subject). But what about other states and regions where groundwater is in overdraft?
A truly great horror story! Yet some people continue to imagine feeding 10 billion people with help from AI, technology, etc. Not only the water problem, soil horizons continue to diminish - the northern plains should return to natural grassland minimum 25 years in every 100. But debt-driven agriculture can't tolerate that. See also: https://www.thebrockovichreport.com/p/we-cant-keep-ignoring-our-water-crisis