

The Chokepoint That Feeds the World
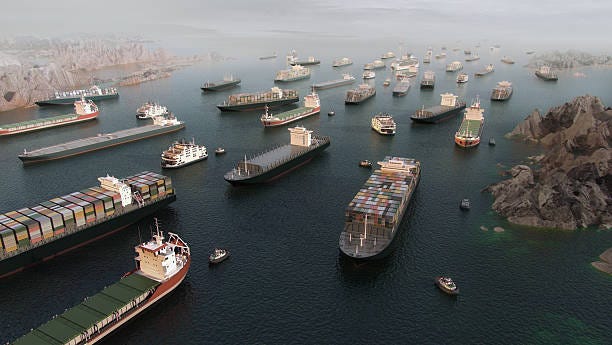
At its narrowest point, the Strait of Hormuz is 21 miles wide.1 Through that sliver of water passes roughly 20% of the world’s traded petroleum2 and, less discussed but no less consequential, a vast share of the ammonia, urea, and phosphate that farmers from Iowa to India use as fertilizer to grow the staple crops that feed the world.3 On February 28, 2026, effective closure of the Strait triggered what analysts are now calling a systemic shock to global food supply chains.4 The ships stopped moving. The fertilizer stopped flowing. The consequences are beginning to be not a distant abstraction, but they are reflected in higher prices at American grocery stores, emptier shelves at food pantries, and spreading hunger across poor and working-class communities in the Western world and vast swaths of the developing world.
The countries of the Persian Gulf region, including Iran, Qatar, Saudi Arabia, and the UAE are among the world’s largest exporters of nitrogen-based fertilizers, particularly ammonia and urea.5 These are not luxury exports. They are the foundational chemistry of modern agriculture. Without sufficient nitrogen fertilizer, corn yields fall, wheat yields fall, rice yields fall, and potato yields fall.6 The global food system that feeds eight billion people7 is now dependent on supply chains that run through a war zone!
The United States is not immune. American farmers purchase significant volumes of imported fertilizer, and even domestically produced fertilizers are priced against global benchmarks that have now spiked to levels not seen since the acute disruptions of 2022.8 In the weeks following the closure, urea prices rose more than 60% on spot markets.9Diammonium phosphate (DAP) is the primary phosphate fertilizer used in US corn and soybean production similarly increased in price.10 For the 3.4 million farm operators11 already navigating the aftermath of climate-driven losses and the smallest US cattle herd since 1951,12 this is not a market fluctuation. It is an existential threat to the economics of growing food.
“American farmers are being forced to absorb a geopolitical shock they did not cause, on top of a climate crisis they did not create. The poor and working class families who depend on affordable food bear the cost of both.”
The Fertilizer Pipeline and What Happens When It Breaks
The green revolution that transformed global food production in the twentieth century rests on three pillars: improved seed varieties, irrigation, and synthetic nitrogen fertilizer.13 That third pillar known as the Haber-Bosch process of fixing atmospheric nitrogen into ammonia is now responsible for feeding roughly half of humanity.14 Remove it, or sharply constrain it, and yields collapse and with them, food security declines and hunger rises.15
The Persian Gulf states have built some of the world’s most competitive fertilizer industries, leveraging cheap natural gas which is the feedstock for ammonia production to produce and export nitrogen fertilizers at scale.16 Qatar is one of the world’s largest urea exporters.17 Saudi Arabia’s SABIC is a major global ammonia supplier.18 Iran, before and alongside sanctions, was a significant fertilizer producer.19 The Strait of Hormuz is not merely the exit for their oil. It is the exit for the nutrients that grow the world’s crops.
With the Strait effectively closed since late February 2026, those supply chains have been disrupted. Ships insured by Lloyd’s and other major underwriters have been unable to obtain war risk coverage for transits through the Gulf.20Fertilizer cargoes contracted for spring 2026 delivery which is critical for the Spring planting season across the Northern Hemisphere are still sitting in Gulf ports, waiting for a resolution of the war that has not come.21 Spring is when farmers apply the bulk of their nitrogen fertilizer. A shortage now means higher prices, thinner applications, substituted inputs, or no applications of fertilizers at all. Each of these outcomes translates, with approximately a one-season lag, into reduced yields and less food for the world.22
A Market Already Under Strain
The USDA’s 2025 Farm Income Forecast showed net farm income falling by $30 billion from its 2022 peak,23 driven by climate-related production losses and rising input costs that were already compounding before the Strait closure. American farmers are not entering this crisis with financial cushion. Total farm debt reached a record $535 billion in 2024,24 and the debt-to-asset ratio for smaller operations is at its highest level since the farm crisis of the 1980s.25
Corn and soybean producers in the Midwest face the prospect of either paying dramatically higher prices for spring fertilizer applications or reducing application rates and accepting lower yields. USDA economists estimate that for every 10% rise in nitrogen fertilizer prices sustained through planting season, the Corn Belt net farm incomes fall by approximately 4 - 7%, depending on a farm’s input-to-revenue ratio.26
Wheat farmers in Kansas and Oklahoma who apply fertilizer in the fall for winter wheat were partially exposed to pre-crisis pricing but those who purchased on the spot market rather than from a pre-existing contract, face the full weight of the spike in the cost of fertilizer. Spring wheat growers in the Northern Plains are entirely exposed. The Southern Plains, already in the grip of accelerating long term drought with more than 60% of this part of the country was classified as in severe or extreme drought at the start of the 2025 planting season.27 These farmers are now contending with a crisis of rising costs of fertilizer and fuel layered on top of a climate driven moisture crisis.
Specialty crop producers in California face a compounded problem. California grows more than a third of the nation’s vegetables and nearly three-quarters of its fruits and nuts.28 A state whose agricultural heartland is already caught between flood and drought now faces the full fertilizer input price shock on top of ongoing weather-driven losses.
Geopolitiflation: What the Hormuz Shock Does to American Food Prices
American consumers were already paying a 6.8% annual grocery inflation rate for the 12 months to June 2025,29 driven in large part by climate-driven supply disruptions and the aftermath of the worst avian influenza outbreak in US history, which killed more than 120 million laying hens between 2022 and early 2025.30 Consumers are now facing a second wave of food price pressure with geopolitical origins. Where 2024 and 2025’s food inflation was primarily driven by weather and disease, the 2026 wave is caused by the fertilizer-to-yield-to-price transmission chain.
The transmission works like this. Higher fertilizer prices raise farmers’ production costs immediately. In the medium term, over one to two growing seasons, reduced fertilizer applications translate into lower yields. Lower yields mean tighter supply. Tighter supply means higher commodity prices. Higher commodity prices mean higher retail prices for bread, corn products, cooking oils, and the meat of animals raised on grain feed. This chain does not move at the speed of a tweet. It moves at the speed of a growing season. But it moves, reliably and historically, to the consumer’s grocery bill.31
Corn is the foundation of the American food system in ways that are often invisible. It is the feed grain that underpins beef, pork, and poultry production. It provides the base for high-fructose corn syrup that sweetens countless processed foods. It is the feedstock for ethanol.32 A sustained corn supply shock, triggered by a fertilizer shortage of the scale implied by the Strait closure, will ripple through nearly every category of the American grocery store.
Wheat, the basis of bread and pasta, is similarly exposed. The US is a major wheat producer and exporter, but global wheat prices set the reference point for domestic prices.33 When global wheat prices rise because India or North Africa faces fertilizer-driven yield shortfalls, American bread prices follow, not because American wheat is scarce, but because American grain traders participate in global markets and export their wheat if they can get higher prices.
“In the United States, the lowest income 1/5 of the population already spends nearly a third of its budget on food. Every percentage point of food price inflation driven by a geopolitical crisis, they played no part in creating, is a meal skipped, a bill unpaid, a child going to school hungry.”
The Potato Problem
Potatoes deserve special attention in any accounting of the Hormuz fertilizer shock but potato production is rarely received discussed. The potato is one of the most nitrogen-hungry crops in commercial agriculture. A productive potato field requires between 150 and 250 kilograms of nitrogen per hectare per season,34 making it significantly more fertilizer-intensive than wheat and comparable to the most demanding corn production systems. For potato growers in Idaho, Washington, Wisconsin, and Maine, the states that together account for the majority of US commercial potato production35 a sustained nitrogen price spike translates quickly into a choice between absorbing a sharp cost increase or accepting meaningfully lower yields.
The global stakes are higher still. The potato is the world’s fourth-largest food crop by production volume, after sugarcane, corn, and wheat,36 and a primary calorie source for hundreds of millions of people across Eastern Europe, the Andes, sub-Saharan Africa, and South Asia. India, the world’s second-largest potato producer, grows over 50 million metric tons annually,37 and relies heavily on urea and DAP applications for the high-yielding varieties that have expanded potato cultivation across the subcontinent. A fertilizer price spike that forces Indian smallholder potato farmers to reduce applications by even 20–30% would produce yield losses that translate directly into caloric shortfalls for some of the world’s most food-insecure populations.
In the United States, the downstream effects reach beyond the farm gate. The processed potato industry that makes frozen French fries, potato chips, and dehydrated potato products generates more than $20 billion in annual sales38 and depends on reliable volumes of consistent-quality potatoes. A harvest reduction in Idaho or the Columbia Basin triggers supply chain disruptions that flow through to fast food chains, food service distributors, and supermarket shelves within a single season.
Who Bears the Weight: Food Insecurity in America’s Hormuz Moment
The United States entered 2026 with 47.4 million people, approximately13.5% of the population already living in food-insecure households,39 a sharp increase from the decade-low of 10.2% recorded in 2021.40 Preliminary data from Feeding America’s nationwide network reported record demand at food pantries in major cities including Houston, Phoenix, Atlanta, and Chicago through 2025.41 More than one in eight people in the richest country in the history of humanity does not know where their next meal is coming from. The Hormuz shock is arriving into a food security landscape already at crisis levels.
The populations most exposed are those with the least capacity to absorb any shock at all. Black, Latino, and Indigenous households experience food insecurity at rates of 22%, 20%, and over 25% respectively which is more than double the white household rate of 9%.42 Rural communities in the Southern Plains, Appalachia, and the Mississippi Delta have the highest rates of food insecurity and the weakest food retail infrastructure.43 They are the communities that first will feel the pinch, and will feel it most deeply, and for the longest period of time.
The Supplemental Nutrition Assistance Program (SNAP) is the buffer that stands between geopolitical food price shocks and mass hunger in America. It is a buffer that is currently under legislative assault. Proposed cuts under consideration in the 119th Congress would eliminate SNAP benefits for up to 8 million people,44 according to the Center on Budget and Policy Priorities. These cuts were debated before the Strait of Hormuz closed. They are being debated now in the Senate, as fertilizer prices spike and farm income projections darken.
The Global Dimension: From the Gulf to the Global South
Countries like Ethiopia, Sudan, Yemen, and Bangladesh were already classified as facing acute food insecurity by the World Food Programme before February 2026.45 The fertilizer shock threatens to turn food insecurity into famine in the most food insecure populations.
When a smallholder farmer in Malawi or Bangladesh cannot afford fertilizer, yield losses of 40–60% are documented outcomes.46 The World Food Programme estimated before the crisis that 333 million people worldwide faced acute food insecurity.47 The Strait of Hormuz closure, coming on top of already-elevated food prices, elevated debt, and climate-driven harvest failures, is a forcing mechanism which will increase the number of people experiencing severe food insecurity that the World Food Programme has been warning about for years.
The United States was the world’s largest donor to the World Food Programme.48 But in April 2025, the Trump Administration notified the World Food Programme that it was terminating funding for emergency programs in over a dozen countries,49 with the WFP characterizing the cuts as a “death sentence” for millions. The State Department subsequently reversed cuts for several nations including Syria and Somalia,50 but maintained cancellations for others. By May 2026, US humanitarian aid had fallen dramatically, from roughly $14 billion to $3.7 billion between 2024 and 2025, a collapse described by Refugees International as a “generational funding collapse.”51 A U.S. harvest diminished by fertilizer shortfalls is a harvest with less surplus available for humanitarian export aid. The Hormuz shock is simultaneously a US domestic food security story and a global humanitarian crisis. Both stories begin at the same chokepoint.
“The Strait of Hormuz is 21 miles wide. The hunger that flows from its closure has no borders.”
What Must Change: Policy Proportionate to the Crisis
The U.S. federal government must reverse course and immediately move to protect and expand SNAP and other nutrition assistance programs in the national safety net to meet the food price volatility that is accelerating, and the increasing populations of Americans who will be most impacted who have no other buffer. In the United States, the lowest 1/5 of the population already spends approximately 30% of its budget on food,46 meaning every percentage point of food price inflation carries outsized consequences for families with the least financial resilience. Cutting nutrition support during a supply chain crisis is not fiscal responsibility – it will cause widespread hunger in America. It is a transfer of the costs of geopolitical risk onto the most food-insecure Americans.
Agricultural policy must pivot toward supply chain resilience. The US currently imports approximately 90% of its potash and 40–55% of its nitrogen fertilizer,47 Making domestic fertilizer production and strategic input reserves a national security imperative and not merely an agricultural preference is imperative. Every year that passes without diversified domestic fertilizer capacity is another year of exposure to the next Gulf crisis.
Investment in agroecological alternatives such as nitrogen-fixing cover crops, soil health practices, and diversified rotations is another national security investment that America must start making. Research has demonstrated that integrated soil-crop management systems can reduce synthetic nitrogen fertilizer requirements by 30–50% while maintaining yields in well-managed systems.48
The United States contributed approximately $1.7 billion to the World Food Programme in fiscal year 2024, roughly 40% of the agency’s total funding.49 Research consistently shows that food insecurity drives political instability, and political instability creates the conditions for the kind of regional conflict that closes straits and severs supply chains. Protecting food aid funding is not charity. It is a strategic military necessity, preventing future civil unrest and regional conflicts.
“The food bank queue is growing. The farm income in America is deteriorating. The fertilizer ship has been sitting in a Gulf port it cannot leave for nearly four months at a critical time for Spring planting in the Northern Hemisphere. All of these are consequences of the same failure: a global food system built for a world of stable supply chains that no longer exists.”
A 21-Mile Warning
The United States has long told itself a story about its agricultural abundance. That story was already being rewritten, season by failing season, by a climate and climate change that do not respect this national mythology. The Strait of Hormuz crisis adds another author to that rewrite: the reality of global supply chains, geopolitical fragility, and a food system whose apparent abundance rests on logistics that can be severed by conflict in a waterway most Americans could not find on a map.
The 47.4 million Americans already food-insecure before February 202650 did not cause the crisis in the Gulf. The farmers of Kansas and Iowa paying 60% more for fertilizer this spring51 did not cause it. The families in Malawi and Bangladesh who may not eat enough this year because they cannot afford the fertilizer to grow enough food did not cause it. But they are paying for it in skipped meals, in mounting debt, in the quiet emergency that food insecurity always is, and that geopolitical crises have a particular capacity to deepen.
The question is whether an American Administration seemingly only intent on enriching the millionaire and billionaire class can respond at the scale the pending hunger crisis demands with supply chain resilience, nutritional protection for those who need it most, meaningful support for the farms most exposed, and the international leadership that the global food system requires. Congress and the Trump Administration must find their way back from protecting concentrated wealth of the top 1% to protecting ordinary people who cannot afford to feed themselves and their families. The 21-mile strait has delivered its warning. The choice of whether to heed the warning of pending food shortages belongs, as it always does, to those in power and whether they understand the desperation and political chaos that profound hunger can engender.
Endnotes
1. US Energy Information Administration (2024). World Oil Transit Chokepoints: Strait of Hormuz. EIA, Washington DC. https://www.eia.gov/international/analysis/special-topics/World_Oil_Transit_Chokepoints
2. US Energy Information Administration (2024). World Oil Transit Chokepoints: Strait of Hormuz. EIA, Washington DC. Approximately 21 million barrels per day transited in 2023, representing ~20–21% of global petroleum liquids trade.
3. International Fertilizer Association (2024). Fertilizer Flows: Global Trade in Nitrogen, Phosphate, and Potash. IFA, Paris. Persian Gulf states account for approximately 15–20% of globally traded nitrogen fertilizer.
4. International Fertilizer Association (2026). Global Fertilizer Supply Chain Impact Assessment: Strait of Hormuz Closure, March 2026. IFA, Paris.
5. Food and Agriculture Organization of the United Nations (2023). World Fertilizer Trends and Outlook to 2026. FAO, Rome. Iran, Qatar, Saudi Arabia, and UAE collectively rank among the top ten global fertilizer exporters.
6. Tilman, D. et al. (2002). Agricultural sustainability and intensive production practices. Nature, 418, 671–677. Liebig, J. (foundational work on nitrogen limitation in plant growth). For yield response curves to nitrogen application rates, see: Scharf, P.C. & Lory, J.A. (2009). Calibrating reflectance measurements to predict optimal side dress nitrogen rate for corn. Agronomy Journal, 101(3), 615–625.
7. United Nations, Department of Economic and Social Affairs (2023). World Population Prospects 2022. UN DESA, New York. Global population reached 8 billion in November 2022.
8. USDA Economic Research Service (2025). Fertilizer Use and Price. ERS, Washington DC. https://www.ers.usda.gov/data-products/fertilizer-use-and-price/. The US imports approximately 40–55% of its nitrogen fertilizer needs, primarily as urea and UAN (urea-ammonium nitrate).
9. Reuters (2026, March 14). Urea prices surge 60% as Gulf fertilizer exports stall on Hormuz closure. Spot urea prices on the New Orleans barge market and Tampa granular market tracked by Green Markets/Bloomberg.
10. USDA Economic Research Service (2026). Fertilizer Price Monitoring Report, April 2026. DAP (diammonium phosphate) is the dominant phosphate fertilizer in US corn and soybean production, accounting for approximately 40% of phosphate fertilizer applications.
11. USDA National Agricultural Statistics Service (2024). 2022 Census of Agriculture: Farm Operator Data. USDA NASS, Washington DC. The 2022 Census recorded approximately 3.4 million farm operators across 2.0 million farms.
12. USDA NASS (2025). Cattle: January 2025 Inventory. USDA National Agricultural Statistics Service. The US cattle herd fell to approximately 86.7 million head, the lowest since 1951.
13. Evenson, R.E. & Gollin, D. (2003). Assessing the impact of the Green Revolution, 1960 to 2000. Science, 300(5620), 758–762.
14. Erisman, J.W. et al. (2008). How a century of ammonia synthesis changed the world. Nature Geoscience, 1, 636–639. The authors estimate the Haber-Bosch process supports the nutrition of approximately 48% of the global population.
15. International Energy Agency (2023). Ammonia Technology Roadmap: Towards More Sustainable Nitrogen Fertiliser Production. IEA, Paris. Natural gas accounts for 70–80% of ammonia production costs; Gulf states benefit from among the world’s lowest natural gas feedstock prices.
16. Fertilizer Canada / International Fertilizer Association (2024). Global Urea Trade Data. Qatar Fertiliser Company (QAFCO) and Qatar Chemical and Petrochemical Marketing and Distribution Company (Muntajat) rank among the world’s top five urea exporters.
17. Saudi Basic Industries Corporation (SABIC) (2023). Annual Report 2023. Riyadh. SABIC is a major producer of ammonia, urea, and related nitrogen products for export.
18. US Geological Survey (2024). Mineral Commodity Summaries: Nitrogen (Fixed) — Ammonia. USGS, Reston VA. Iran was a significant nitrogen fertilizer exporter prior to and alongside sanctions; production capacity estimated at 6–8 million metric tons per year of ammonia.
19. Lloyd’s of London (2026). War Risk Insurance Exclusion Zone: Persian Gulf Update, March 2026. The Joint War Committee designated the Persian Gulf as a Listed Area following the Strait closure, effectively requiring separate war risk coverage at prohibitive rates for most commercial operators.
20. International Fertilizer Association (2026). Global Fertilizer Supply Chain Impact Assessment, March 2026. IFA, Paris.
21. Dobermann, A. & Cassman, K.G. (2002). Plant nutrient management for enhanced productivity in intensive grain production systems of the United States and Asia. Plant and Soil, 247, 153–175. Yield response to nitrogen application reduction is approximately linear at suboptimal application rates, with a 30–40% reduction in application associated with a 15–25% reduction in yield under typical Corn Belt conditions.
22. USDA Economic Research Service (2025). Farm Income and Wealth Statistics: Net Farm Income Forecasts. ERS, Washington DC. Net farm income peaked at approximately $182 billion in 2022 and was forecast at approximately $140–150 billion in 2025.
23. USDA Economic Research Service (2026). Fertilizer Price-Yield Transmission Analysis: 2026 Planting Season Scenarios. ERS, Washington DC. Estimates reflect the range across farm sizes and crop mixes; larger farms with more contracted inputs show smaller percentage income impacts.
24. USDA Drought Monitor (2025). Drought conditions across the continental United States, April 2025. University of Nebraska–Lincoln / USDA / NOAA. https://droughtmonitor.unl.edu
25. California Department of Food and Agriculture (2024). California Agricultural Statistics Review 2023–24. CDFA, Sacramento. California accounts for approximately 35% of US vegetables and 65–75% of US tree nuts, fruits, and berries by value.
26. USDA Economic Research Service (2025). Food Price Outlook, 2025: CPI for All Food. ERS, Washington DC. The 12-month food-at-home (grocery) inflation rate for June 2025 was recorded at 6.8%, above the 20-year average of approximately 2.5%.
27. USDA Animal and Plant Health Inspection Service (2025). Highly Pathogenic Avian Influenza Detections in Commercial and Backyard Flocks. USDA APHIS. Cumulative flock losses exceeded 120 million birds between early 2022 and March 2025.
28. Headey, D. & Fan, S. (2010). Reflections on the global food crisis: how did it happen? How has it hurt? And how can we prevent the next one? IFPRI Research Monograph 165. International Food Policy Research Institute, Washington DC. Documents the fertilizer-price-to-food-price transmission mechanism historically.
29. USDA Economic Research Service (2024). Feed Grains Database. ERS, Washington DC. Approximately 36% of US corn production is used for animal feed, 35% for ethanol, and 11% for high-fructose corn syrup and other food products.
30. Kastner, T. et al. (2012). Global changes in diets and the consequences for land requirements for food. Proceedings of the National Academy of Sciences, 109(18), 6868–6872. US wheat prices track the Chicago Board of Trade (CBOT) benchmark, which integrates global supply and demand including export markets.
31. USDA Economic Research Service (2024). Food Security in the United States: Key Statistics and Graphics. Based on the December 2023 Current Population Survey Food Security Supplement. 47.4 million people in 18.0 million food-insecure households; 13.5% of US households.
32. Coleman-Jensen, A. et al. (2022). Household Food Security in the United States in 2021. USDA ERS Report ERR-309. Washington DC. The 2021 household food insecurity rate of 10.2% was the lowest recorded since the survey began tracking in 1995.
33. Feeding America (2025). The State of Hunger in America 2025. Feeding America Research Team. Based on data from the Feeding America network of 200 food banks serving 60,000+ food pantries.
34. USDA ERS (2024). Food Security in the United States: Definitions of Hunger and Food Security. Tabulations by race/ethnicity from the 2023 CPS Food Security Supplement. White non-Hispanic household food insecurity rate: 9.1%; Black non-Hispanic: 22.4%; Hispanic: 19.9%; American Indian/Alaska Native: 26%+.
35. Nord, M. & Coleman-Jensen, A. (2010). Food insecurity in households with children: Prevalence, severity, and household characteristics. USDA ERS Economic Information Bulletin EIB-56. Rural food insecurity rates consistently 2–4 percentage points higher than urban rates in SNAP-eligible counties across Southern Plains and Appalachian regions.
36. Center on Budget and Policy Priorities (2025). Proposed SNAP Cuts Would Harm Millions of People Facing Hardship. CBPP, Washington DC. Analysis of proposed work-requirement expansions and benefit restructuring under the 119th Congress.
37. World Food Programme (2025). Global Report on Food Crises 2025. WFP, Rome. Ethiopia, Sudan, Yemen, and Bangladesh all classified in IPC Phase 3 (Crisis) or above; Yemen and Sudan had populations in IPC Phase 4 (Emergency).
38. Vanlauwe, B. et al. (2011). Agronomic use efficiency of N fertilizer in maize-based systems in sub-Saharan Africa within the context of integrated soil fertility management. Plant and Soil, 339, 35–50. Yield gaps between fertilized and unfertilized smallholder plots of 40–60% are consistently documented across sub-Saharan African and South Asian smallholder systems.
39. Murphy, S. et al. (2012). Cereal Secrets: The World’s Largest Grain Traders and Global Agriculture. Oxfam Research Reports. Archer-Daniels-Midland, Bunge, Cargill, and Louis Dreyfus (‘ABCD’ traders) collectively handle the majority of global grain trade. For profit performance in 2024–25, see individual company annual reports.
40. Cargill Inc. (2025). Fiscal Year 2025 Annual Report. Cargill Inc., Minneapolis MN. Revenue reported at $177.4 billion for fiscal year ending May 2025.
41. International Fertilizer Association (2026). Fertilizer Market Snapshot: Post-Hormuz Closure Supply Reorientation. IFA, Paris. Fertilizer demand shifted rapidly to Russian, Moroccan, and Canadian suppliers following Gulf supply disruption.
42. Food and Agriculture Organization of the United Nations (2024). World Fertilizer Trends and Outlook. FAO, Rome. Russia is the world’s largest exporter of nitrogen fertilizers, the second-largest exporter of potash, and the third-largest exporter of phosphate fertilizers.
43. Environmental Working Group (2025). Crop Insurance: Who Benefits? Federal Subsidy Flows and Industry Lobbying. EWG, Washington DC.
44. USDA Risk Management Agency (2025). Summary of Business: 2024 Crop Year. USDA RMA, Washington DC. Total program liabilities reached $17.3 billion in 2024; inflation-adjusted 2010 expenditure was approximately $8 billion.
45. USDA RMA (2025). Summary of Business: 2024 Crop Year, by Farm Size. Large commercial operations (>$1M gross sales) received approximately 65% of indemnity payments while representing less than 5% of all insured farms.
46. Bureau of Labor Statistics (2024). Consumer Expenditure Survey 2023. BLS, Washington DC. Lowest income quintile (under ~$22,000 annual household income) allocated approximately 29–32% of total expenditures to food.
47. US Geological Survey (2024). Mineral Commodity Summaries: Potash; Nitrogen (Fixed). USGS, Reston VA. The US imports approximately 90% of its potash from Canada and Belarus/Russia and 40–55% of its nitrogen fertilizer requirements.
48. Cui, Z. et al. (2018). Pursuing sustainable productivity with millions of smallholder farmers. Nature, 555, 363–366. Documents 30–50% reductions in fertilizer application with maintained or improved yields under optimized integrated soil-crop management in Chinese smallholder systems; results are directionally applicable to US contexts.
49. World Food Programme (2024). WFP Annual Report 2023: Donor Contributions. WFP, Rome. US government contributions to WFP totaled approximately $1.73 billion in calendar year 2023, representing approximately 40% of total WFP contributions.
50. USDA Economic Research Service (2024). Food Security in the United States: Key Statistics and Graphics. See endnote 31.
51. Reuters (2026, March 14). Urea prices surge 60% as Gulf fertilizer exports stall on Hormuz closure. See endnote 9. The 60% figure refers to spot urea prices; contracted prices vary; farmers purchasing on spot or at expiring contracts face the full increase.