

For most of modern history, Americans pictured drought as someone else’s problem such as a Dust Bowl photograph in a history textbook, a crisis that happened in the Horn of Africa or the Sahel, something geographically distant and climatologically specific. That picture is now badly, dangerously out of date.
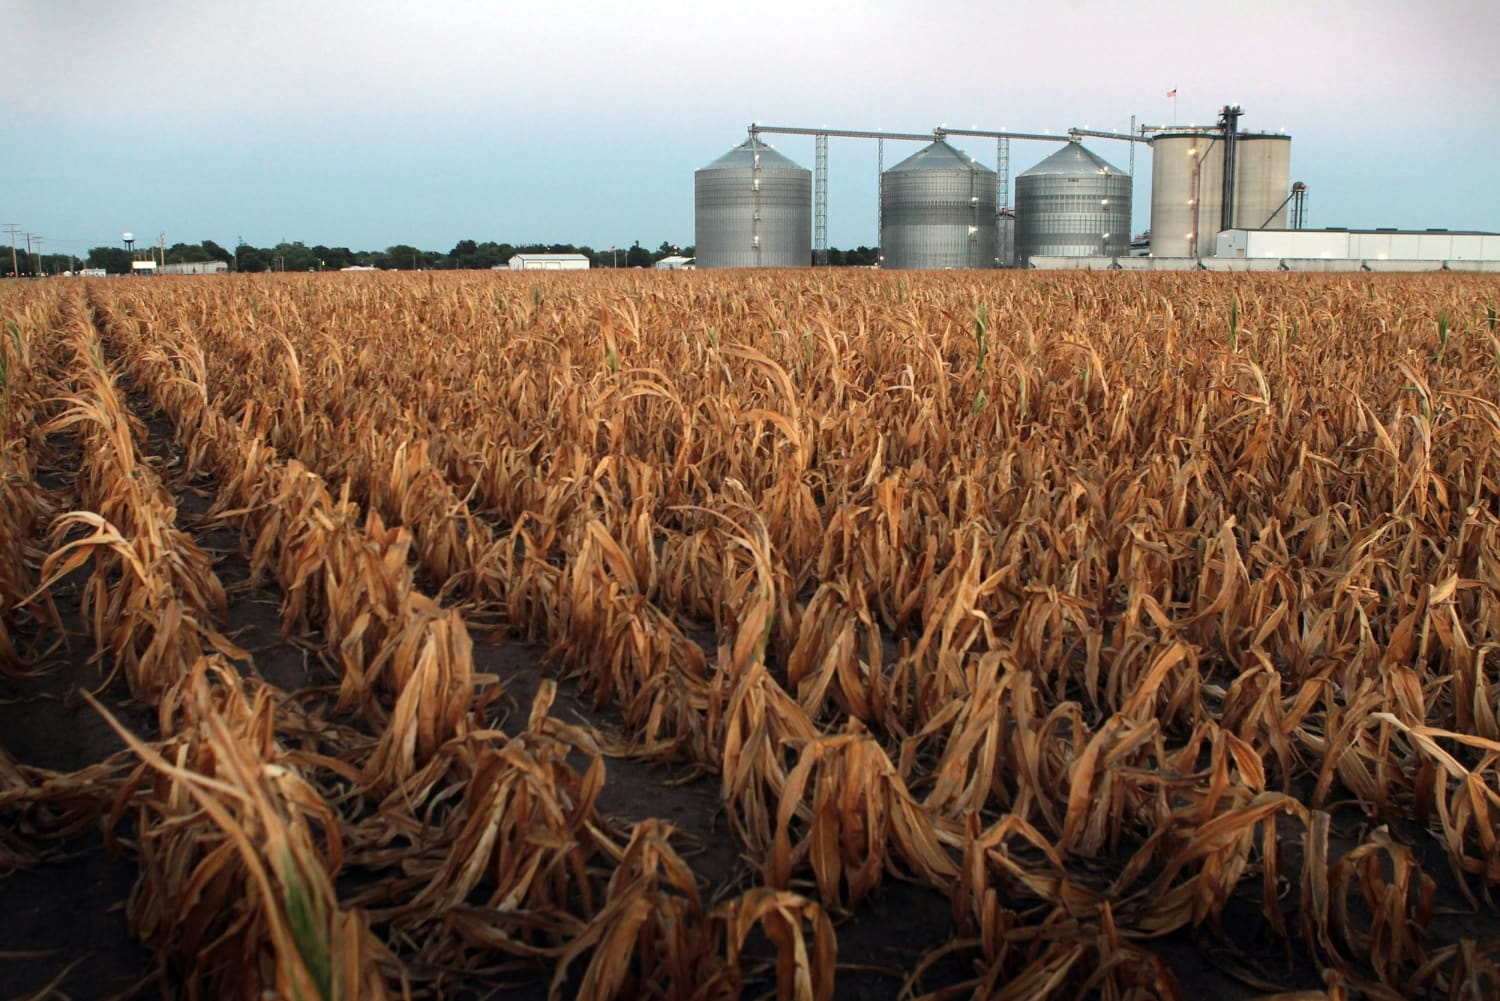
The drought that has consumed the United States since 2024 is not a weather event waiting to be resolved. It is a regime change that is reshaping the economics of food production, the structure of the cattle industry, and the fiscal viability of hundreds of thousands of family farms. And, as the evidence from Massachusetts to Texas now makes clear, no region of the country is sitting safely outside its perimeter.
Researchers increasingly speak of a “polycrisis” in American agriculture: not one systemic shock but several, arriving simultaneously and amplifying each other until the damage is not additive but multiplicative. The same drought that destroys a wheat field drives up the cost of livestock feed, which forces ranchers to liquidate their breeding herds, which constrains beef supply for years to come, which pushes food prices beyond the reach of families who were already spending nearly a third of their income on groceries. Each crisis knocks out the defenses a farm or a food system would have used against the others.
By mid-June 2026, the pathway from cracked soil to empty grocery shelf has become frighteningly short.
A National Footprint, not a Regional Anomaly
The U.S. Drought Monitor’s June 2026 assessment reveals a national footprint spanning four categories of severity, with exceptional drought, the worst classification entrenched across the Southern Plains and High Plains, including the cow-calf heartland of Nebraska and Texas, now in its sixth consecutive year of sustained dryness. Extreme drought conditions have taken hold across the Western Corn Belt and the Southwest. And moderate to severe drought has spread into the Southeast, parts of the West, and into the Northeast.
U.S. Drought Status - June 2026
Federal U.S. Drought Monitor and state-declared conditions
National Overview (Federal USDM, June 9, 2026)
As of June 9, 2026, the federal U.S. Drought Monitor reported 46.93% of the United States and Puerto Rico, and 56.16% of the Lower 48 states are in drought (Moderate, D1, or worse), affecting roughly 150 million people. Forty-five states were experiencing Moderate Drought or worse. Severe Drought (D2) expanded across the Northeast, Mid-Atlantic, and Minnesota amid widespread heat, while hit-or-miss rainfall improved parts of the Plains and South.
Drought category Approx. share of U.S. area
Abnormally Dry (D0) ~15%
Moderate Drought (D1) 16.4%
Severe Drought (D2) 18.2%
Extreme Drought (D3) 8.8%
Exceptional Drought (D4) 0.9%
Active drought (D1–D4) covered roughly 44% of U.S. area.
National Update (federal USDM, June 18, 2026 — latest weekly release)
The June 18 U.S. Drought Monitor is the most recent weekly map, with data valid through June 16 shows the national picture finally bending, though unevenly. Heavy rain across the Midwest and the central and southern Plains drove widespread improvement, with Tropical Storm Arthur approaching the southeastern Texas coast and promising further relief across the Deep South. Ohio, Indiana, and nearly all of Michigan are now free of drought and abnormal dryness, and even a slice of the exceptional-drought Texas Panhandle was downgraded after two to four inches of rain. As of this update, however, the National Drought Mitigation Center had not yet posted revised June 18 national category percentages, so the June 9 totals above remain the most recent official national breakdown.
The improvement is not universal, and in places the drought is deepening. In northern Minnesota, severe drought pushed north toward the Canadian border, dragging down the headwaters of the Mississippi; north-central Iowa picked up a new patch of moderate drought; and across the High Plains the core of the crisis held firm, with the most severe and exceptional conditions still stretching from eastern Wyoming into western and northern Nebraska and far southern South Dakota, and worsening in eastern Colorado and northwestern Kansas. New England stayed hot and dry, keeping the Northeast under pressure even as the national footprint shrank. The human signal is unmistakable on the ground: on June 15, the town of Liberty in south-central Kentucky declared a state of emergency as the lake that serves as its water supply fell to critical lows, while Florida and southern Georgia continued to report serious water-supply concerns, with Lake Okeechobee still losing more water than it takes in.
The forecast offers cautious relief. NOAA has issued an El Niño Advisory, with the pattern expected to strengthen into the fall, and near-term outlooks favor above-normal rain across much of the Midwest and the Ohio Valley. But the Southwest’s summer monsoon, however wet, is not expected to refill the Colorado or Rio Grande systems, and forecasters warn the south-central Plains could reintensify later in the summer. The national trend line, in other words, is improvement at the margins layered over a drought whose hardest cores which are in the High Plains, the West, and now the Upper Midwest have not yet released their grip.
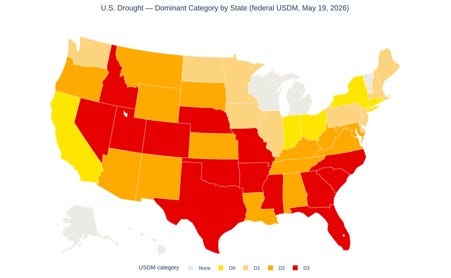
Dominant drought category by state, U.S. Drought Monitor, May 19, 2026 (most recent complete state-by-state set). “Dominant” = the category covering most of a state’s area; this differs from the June 9 national totals above.
Critically: the damage compounds.
Recent ecological research confirms that drought duration and intensity interact to magnify losses in primary productivity in a non-linear way. Four consecutive years of extreme conditions can cause productivity losses to skyrocket by approximately 2.5-fold compared to the first year. The extended duration into 2026 means agricultural systems are no longer merely stressed. Their baseline resilience is fracturing.
“The drought that began as a weather event has solidified, by June 2026, into a long-duration environmental shock: one that the nation’s crisis-response architecture was not built to handle.”
The Wheat That Wasn’t
There is a number at the center of the 2026 grain crisis that deserves to be repeated until it lands with the weight it carries: 1.525 billion bushels. That is the U.S. total wheat production forecast for 2026. It is the smallest domestic harvest in 54 years. The average production for the last 50 years was 2.1 billion bushels a year, 575 million bushels more than produced in 2026!
In the Southern Plains, Hard Red Winter production has been slashed to 515 million bushels, this is a 36% collapse from 2025 in a single season. In Texas and Oklahoma, nearly 32% of planted acres will not be harvested at all. Crop scouts in northern Kansas reported average yields of 38.3 bushels per acre, against a prior-year average of 50.5. Those missing 12 bushels per acre are the entire profit margin for a family operation, and the baseline global supply that prices wheat from Cairo to Kampala.
The season-average farm price for wheat is now projected at $6.00 per bushel, a forecast USDA actually lowered by 50 cents in June, because bumper harvests in Russia, Turkey, and Ukraine swelled global supply even as the American crop shrank. It is a hard lesson in how a globally traded commodity behaves: a devastated U.S. harvest does not guarantee a price windfall. Higher prices benefit farmers who have a crop to sell, but for the third of producers who will harvest nothing from their winter wheat fields this year, the price is irrelevant either way.
The Cattle That Were Sold
The livestock story is the most structurally consequential chapter of this crisis. When drought destroys rangeland forage, ranchers face an immediate ultimatum: purchase expensive supplemental feed or liquidate their herds. Across the Southern Plains and Southeast, producers have overwhelmingly chosen the latter. The total U.S. cattle inventory has fallen to 86.2 million head — the smallest since 1951. The beef cow herd stands at 27.6 million head, its lowest point since 1961.
The Female Slaughter Ratio tells the story in a single metric. When the proportion of female cattle sent to slaughter rises above 48%, the national herd is in liquidation. In the first quarter of 2026, that ratio climbed to 49.9%. Even at record cattle prices, ranchers in the Southern Plains are unwilling to bet on a heifer whose survival depends on rain that may not come. Tyson Foods has closed its facility in Lexington, Nebraska. Walmart is building independent processing infrastructure. And in June 2026 a new biological threat entered the picture: USDA confirmed New World screwworm — a flesh-eating livestock parasite — in Texas, prompting animal-movement restrictions and quarantines that further squeeze an industry already in retreat. Ground beef is no longer a staple. It is becoming a luxury.
“The drought did not create the fragility. It revealed it. That distinction matters because the same dynamic is now visible from the Plains to the Northeast.”
The Cost That Doesn’t Stop
Urea and nitrogen fertilizer prices surged by 47% in a single month in early 2026. Per-acre production costs have climbed to $890 for corn, $1,336 for rice, and $965 for cotton. Matched against drought-depressed yields, a significant share of American row-crop agriculture is now operating at a net loss.
The American Farm Bureau Federation estimates total net losses across the sector will exceed $50 billionover the three years ending in 2026. The latest agricultural census documented the loss of 140,000 farms between 2017 and 2022, and this is a trend every analyst expects to accelerate.
Lower-income American households were already spending nearly 30% of their total disposable income on food before the worst of 2026’s inflation arrived. Beef prices are projected to rise 6.3% this year. Fresh vegetables, 4.8%. Sugar and processed sweets, 8.1%. The drought that began silently in the topsoil of Oklahoma ends as a direct threat to household food security across every American city.
The El Niño Wildcard
Hanging over every projection in this report is a single shift in the Pacific Ocean. On June 11, NOAA’s Climate Prediction Center issued an El Niño Advisory: the warm phase of the El Niño - Southern Oscillation has formed and is expected to strengthen into the winter of 2026–27, with forecasters putting the odds of a “very strong” event between November and January at roughly 63 percent, strong enough to rank among the most powerful El Nino ever recorded since records began in 1950. After five of the past six winters ran in the opposite, drought-deepening La Niña phase, the arrival of El Niño is the first large-scale climate signal in years that could work in American agriculture’s favor. But “could” is the operative word.
The textbook El Niño nudges the Pacific jet stream south, steering wetter, cooler weather across the southern tier of the country from late fall into spring, precisely the Southern Plains and Southwest where this drought has been entrenched for the longest time. Past El Niño winters, among them 1957–58, 1982–83, 1997–98, and 2015–16, acted as outright drought-busters there. Yet NOAA is explicit that the pattern guarantees nothing: the 2023-24 event fizzled across the South, and the agency’s new Relative Oceanic Niño Index, adopted in February 2026 to account for warming oceans, has tended to dampen the apparent strength of these events. Even a textbook outcome carries a sting in the tail, because the same southward storm track typically leaves the Ohio and Tennessee valleys, the Northern Rockies, and the Pacific Northwest drier than normal, and the winter rain that greens up western rangeland can simply become wildfire fuel once summer heat returns. For Massachusetts and the wider Northeast, the El Niño signal is weak and mixed, offering little assurance of relief.
For food production the calculus is genuinely double-edged. A wetter second half of the growing season would favor the corn and soybean belt, consistent with the historical pattern in which U.S. soybean yields improve by roughly 2 to 5 percent in El Niño years, and a wet Southern Plains winter could finally let drought-stricken winter wheat re-establish for the 2027 harvest. But none of that reaches this year’s devastated crop, and the relief, if it comes, arrives on a lag: the production impact of an ENSO event typically peaks six to twelve months after the ocean signal does, pushing the real consequences, for better and for worse, into 2027 and 2028.
The larger risk is global, and it runs straight back to the American grocery shelf. A strong El Niño tends to parch exactly the regions the United States leans on to backfill a short domestic harvest: it weakens the Indian and Southeast Asian monsoons that govern rice, dries the West African and Indonesian belts that dominate cocoa and palm oil, and historically cuts Australian wheat exports. The Food and Agriculture Organization has already issued a joint anticipatory-action appeal with the World Food Programme covering the 2026–27 El Niño window, and analysts warn the event is landing atop a fertilizer market still disrupted by conflict in the Middle East. Because El Niño’s effect on global temperature is usually strongest in its second year, the heaviest pressure on world food prices, and on the imported staples that buffer American supply, is likely to build through 2027. The same pattern that may rescue the wheat fields of Oklahoma could, in the very same stroke, raise the price of the rice, sugar, and cooking oil sitting beside the flour on the shelf.
“El Niño is the first climate signal in years that could ease America’s drought. But a pattern that waters the Southern Plains while drying the rice paddies of Asia does not so much end the food crisis as redistribute it.”
The Warning in the Soil
The Southern Plains have been in drought stress for six consecutive years. The High Plains Aquifer is not recovering on any human timescale. The cattle herd will not rebuild before 2028 at the earliest.
The path from cracked soil to empty shelf is shorter than it has ever been. The encouraging news is that the same connections that make it dangerous also make it solvable, but only if policymakers are willing to treat this not as a series of isolated seasonal disasters but as the deeply connected, compounding crisis the science now tells us it has become.
For Massachusetts and for the nation, the warning is already in the soil. The question is whether we are listening and whether we are pushing our politicians to act.
Notes & Caveats
• “Dominant” category is the level covering most of a state’s area; a state can hold more-severe pockets (e.g., D3/D4) not reflected by its dominant class. No state was dominantly D4.
• The federal USDM (D0–D4) is updated weekly and mapped at sub-county detail; state systems use their own indices and update monthly or on demand, so levels and dates can differ.
• Dates are mixed by design: state-by-state dominant categories reflect May 19, 2026 (the most recent complete state-by-state set); the official national category totals reflect the June 9, 2026 U.S. Drought Monitor, which remained the most recent national breakdown posted by the National Drought Mitigation Center as of this update; the qualitative national update reflects the June 18, 2026 U.S. Drought Monitor (data valid June 16), the latest weekly release; Massachusetts reflects the state’s June 9, 2026 declaration; and crop and livestock figures reflect USDA’s June 11, 2026 WASDE and the January 30, 2026 Cattle report. This update is current as of June 21, 2026.
• Massachusetts’ drought regions are defined by groups of towns; county shading maps those regions onto counties as a close approximation (Norfolk spans the Northeast and Southeast regions).