

The Year the Averages Lied
Halfway through 2026, the food system tells two stories, and only one is reassuring. The reassuring one is in the aggregates: the FAO Food Price Index sat at 130.3 in June, barely above a year earlier and nearly a fifth below its 2022 peak, with the world’s cereal harvest tracking toward its second-largest ever on full reserves.¹ The other is written crop by crop: vegetable oils prices were 23 percent higher than a year ago and meat set an all-time record; a flood erased a fifth of a Bangladeshi rice season; drought sat over half the world’s cocoa belt; Spain gathered its smallest orange crop in sixteen years; two thirds of U.S. winter wheat was not healthy enough to harvest.² The averages held. The specifics did not.
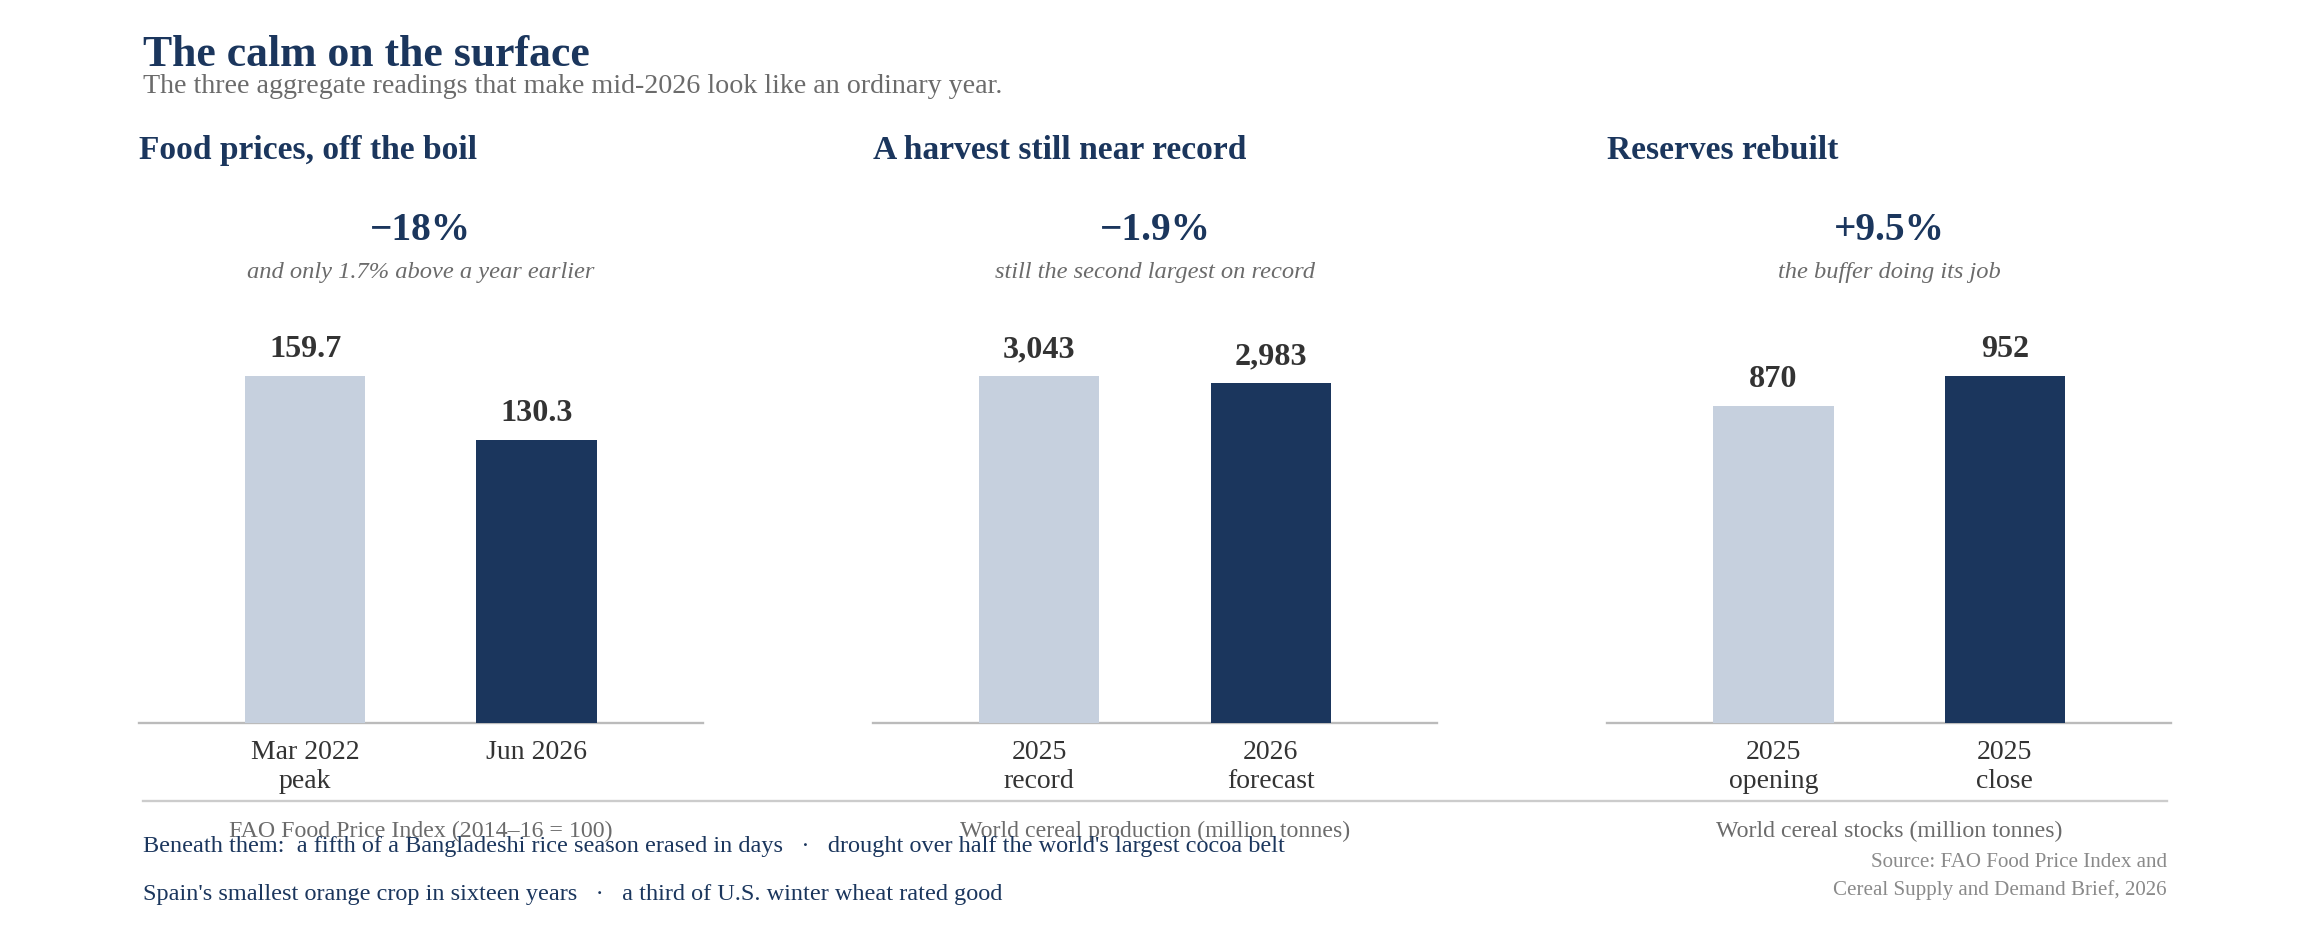
Figure 1. The calm on the surface. The aggregate readings behind the reassuring story of mid-2026 — a food-price index below its 2022 peak, a near-record cereal harvest, rebuilt stocks. All axes begin at zero, so the bars sit almost level; the damage is not visible at this altitude. Source: FAO, 2026.
An annual average is a place to hide. It is the crop, the region, and the week that tell you where the climate actually landed and in 2026 it landed unevenly, and hard.
What follows takes stock of what the first six months have already done to real crops in real fields, and a glance at the landscape on which the coming El Niño will land.
The Crops That Failed First
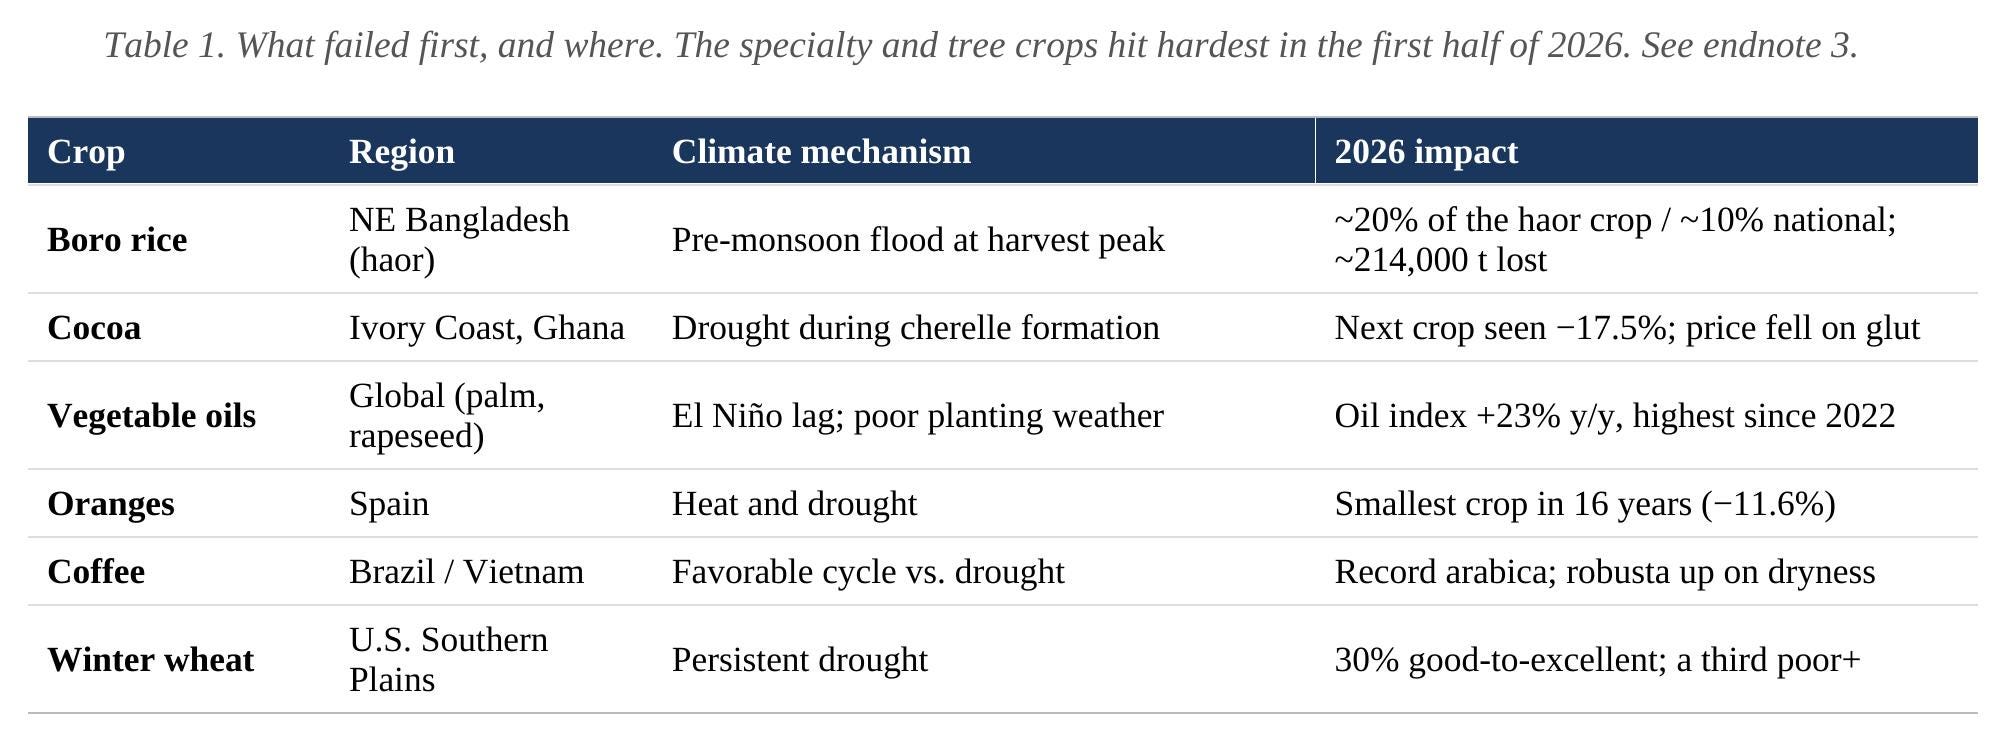
The clearest losses fell on the specialty and tree crops that smallholders grow and no national average can rescue. A pre-monsoon flood took the Bangladeshi boro rice at harvest peak; drought hit the West African cocoa belt during pod formation even as the price fell on a demand glut, the falling price is not the result of a healthy crop; and the vegetable-oil index, showing prices up 23 percent to its highest since 2022, is where the year’s bad weather actually shows up on the shelf due to limited supply.³
The People at the Growing End
Every figure has a household behind it, and for specialty crops it is usually a smallholder with no cushion. In Bangladesh the April floods hit more than 236,000 farming families and destroyed some 214,000 tonnes of rice with no chance to replant; in West Africa, when futures collapsed, Ivory Coast cut its farmgate price by more than half, to about $2.13 a kilogram, so growers caught the downside of a boom they never shared; and Vietnam’s coffee farmers will face a confirmed El Niño before they have recovered from the last drought.⁴
A staple crop failing is a statistic in a report. A specialty crop failing is a family with one income, one harvest, and no cushion.
Meat: A Record and Its Mirror
One line in the world ledger never stopped climbing: the FAO Meat Price Index reached a record 131.0 in June, about a third above its 2014–2016 base. But an index is not a butcher’s ticket, and June’s record was written mostly in poultry — higher Brazilian export prices and firm lamb quotations — while global beef and pork prices actually eased.
The American cattle story is the mirror, and it runs the other way. The U.S. herd has shrunk to 86.2 million head, the smallest since 1951, after eight years of contraction and drought-driven liquidation that no single season can reverse. It shows up not in the global index but on the domestic shelf, where retail ground beef has climbed past $6.80 a pound; and because rebuilding a herd takes three to four years, relief is unlikely before 2028.⁵
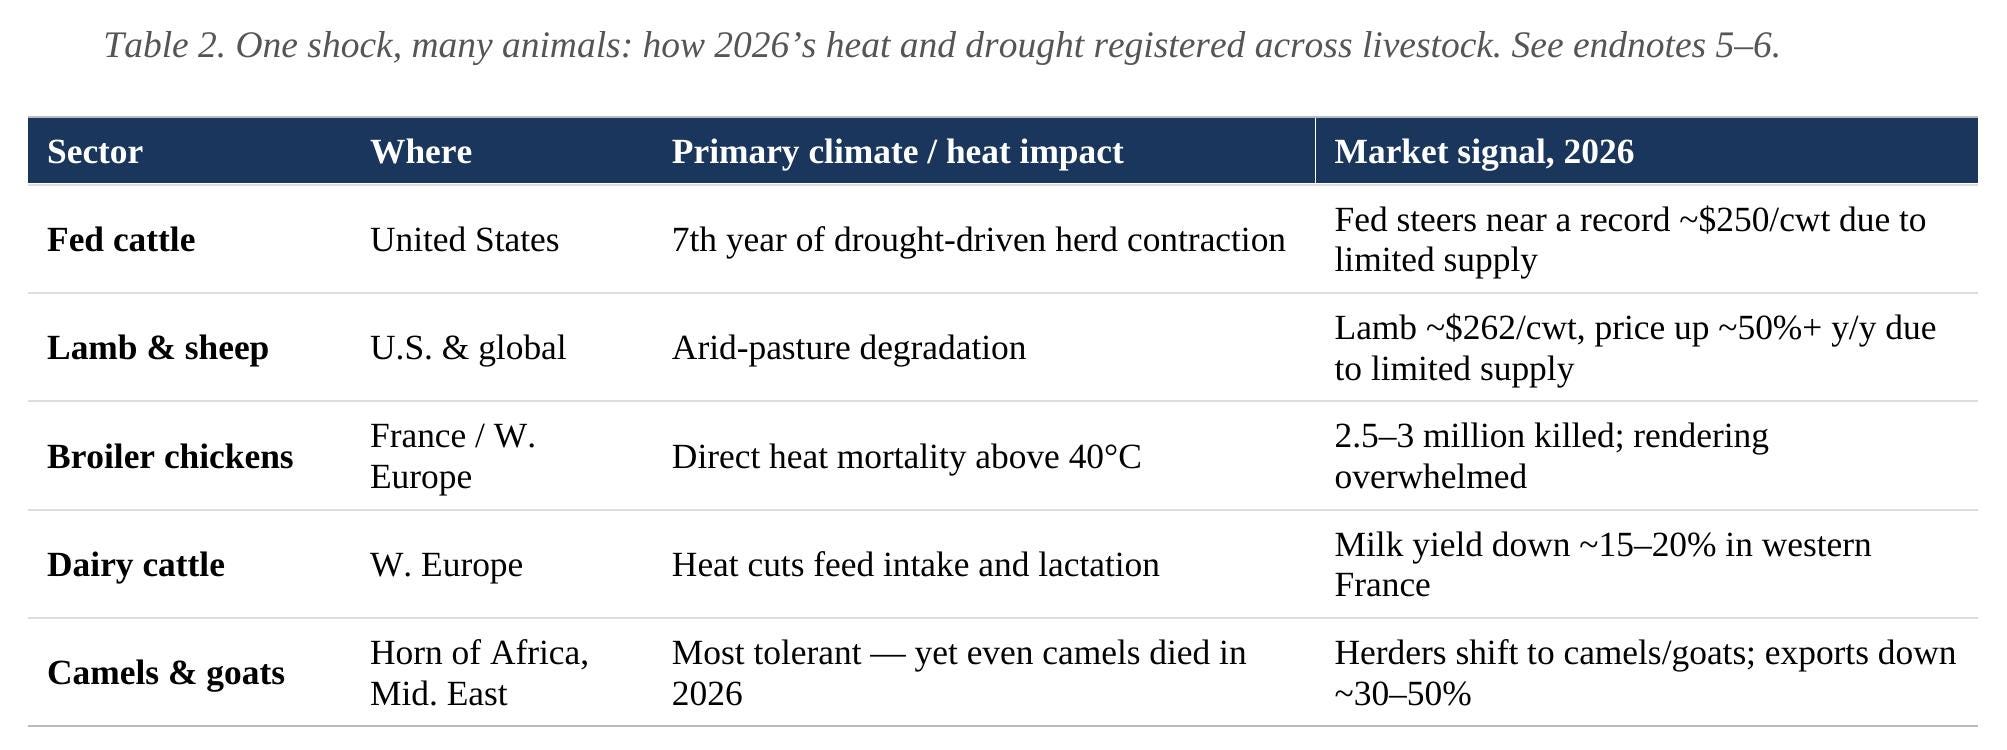
The heat reached every animal. Sheep and goats lose lambing on burnt pasture, even the drought-proof camels of the Horn of Africa have begun dying, and a late-June European heatwave killed an estimated 2.5 to 3 million French broiler chickens.⁶
Grain: The Averages Lied Again
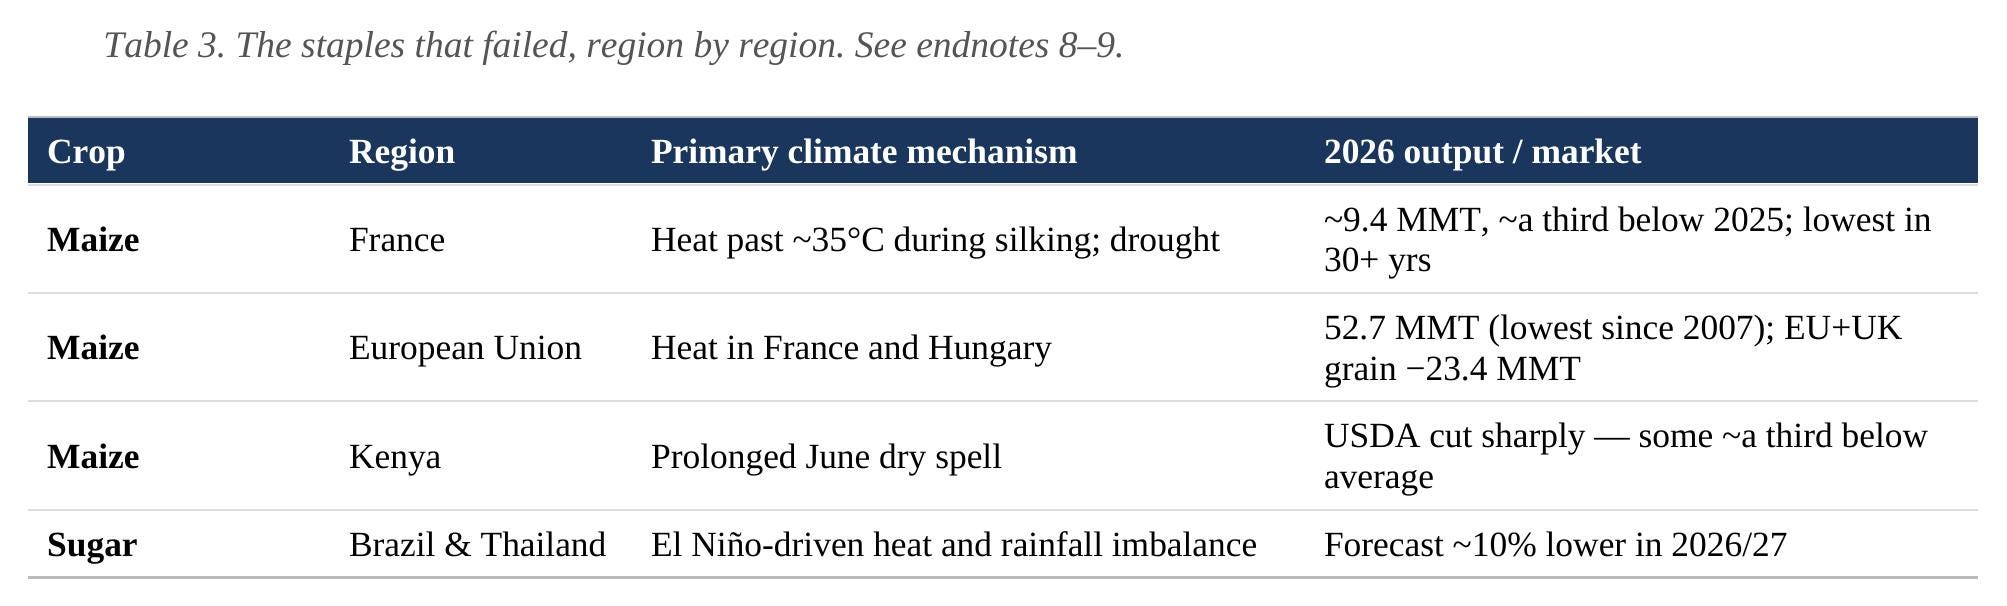
If one crop proves the thesis, it is European maize. A third heatwave since late May burned France’s crop to about 9.4 million tonnes, a third below last year and its smallest in over three decades, and COCERAL cut EU-and-UK grain by 23.4 million tonnes.⁸ A fourth heatwave is hitting France right now. Kenya’s maize fell on a June dry spell and Brazil–Thailand sugar is seen down a tenth. Gathered in a table the failures are dramatic; gathered in the world total they nearly vanish. That gap is the whole argument of the impacts of climate change on hunger.⁹
The Southern Hemisphere’s Dry Turn
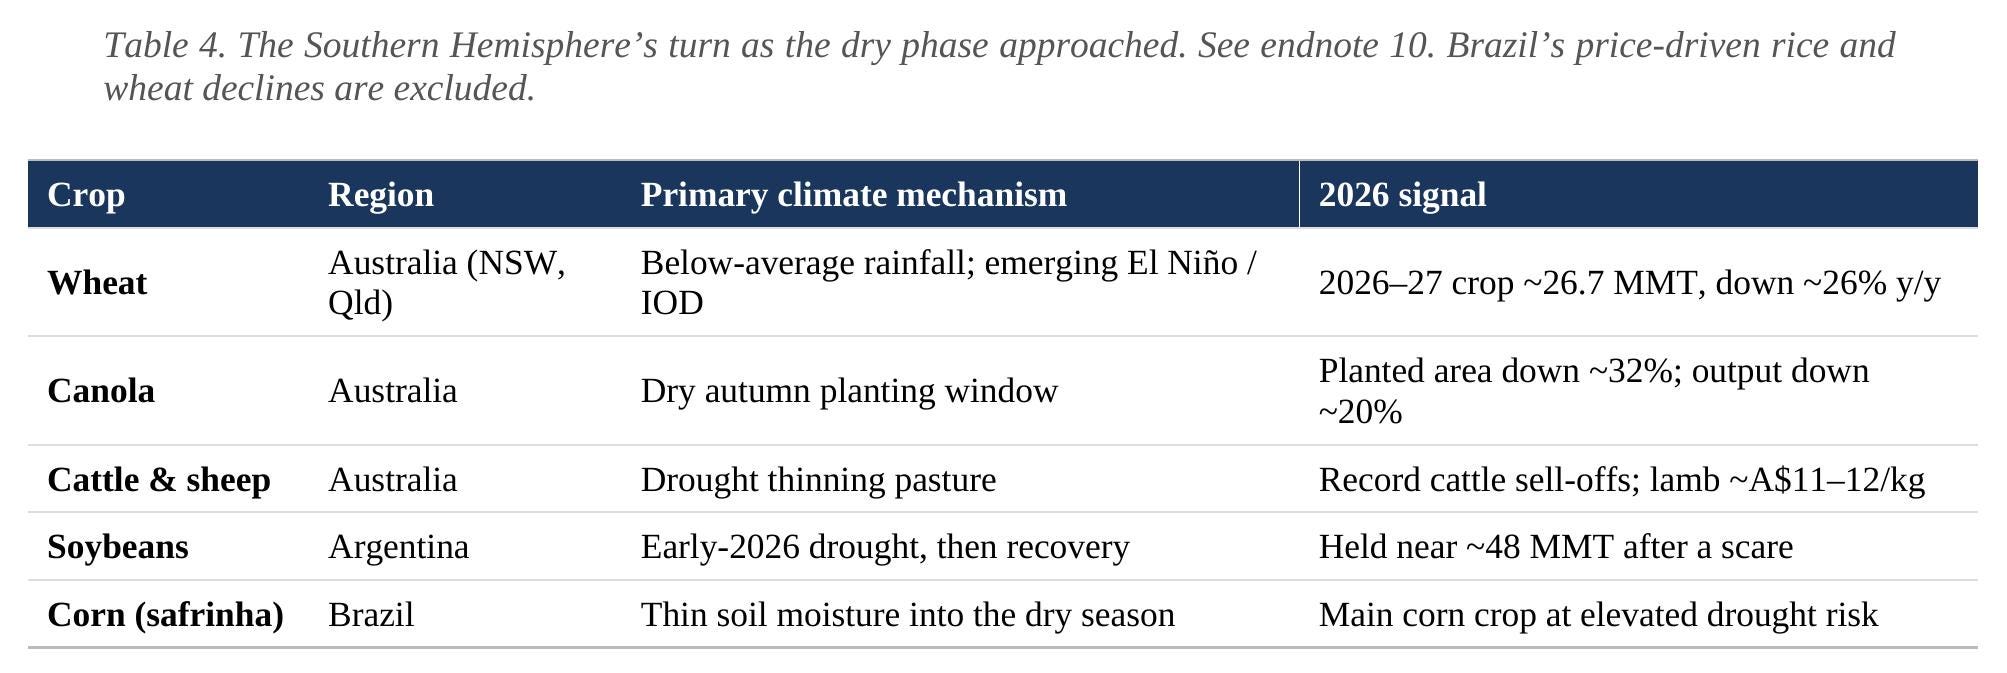
The El Niño’s dry phase has reached the south before the harvest even began. Australia’s dry autumn cut canola area by nearly a third and trimmed the wheat crop toward 26.7 million tonnes for 2026–27, 25% below last year, with ranchers selling cattle in record numbers; across the Pacific, Argentina’s early-2026 drought scare eased and Brazil banked a record soybean crop even as its safrinha corn went into the dry season on thin soil moisture.¹⁰
What the Ledger Says, and What Comes Next
Add the six months together: the shocks were real but regional, sharp but not systemic, concentrated in the crops least able to average out and cushioned by a record 2025 harvest and full reserves.¹¹
So far, 2026 has bruised the food system without breaking it. The open question is what happens when the next blow as a super El Niño lands before the bruises heal.
Every shock so far landed in the first half of a year whose defining event does its worst work in the second. On June 11 the U.S. Climate Prediction Center confirmed an El Niño observed, not forecast, with a better-than-96-percent chance of persisting and a peak near +3.6°C that would be the strongest El Niño ever to impact the world since records have been kept. It will be landing on the growing seasons of the Southern Hemisphere and the tropics. ¹² The sharpest forward risks include Philippine rice, a quarter to a third at risk; a weak Indian monsoon and a held sugar-export ban; and palm oil, where Indonesia and Malaysia hold 88 percent of supply on thin stocks. The pivotal case is southern Africa, but two La Niña years left near-record stocks, so even a real drought should bite more softly than 2016.¹³
The distribution has shifted toward the harder outcomes. The crops at risk are already named, and the reserves are being drawn down before the peak arrives. The forecast is conditional. The window to act on it is not.¹⁴
The Humanitarian Map of the Second Half
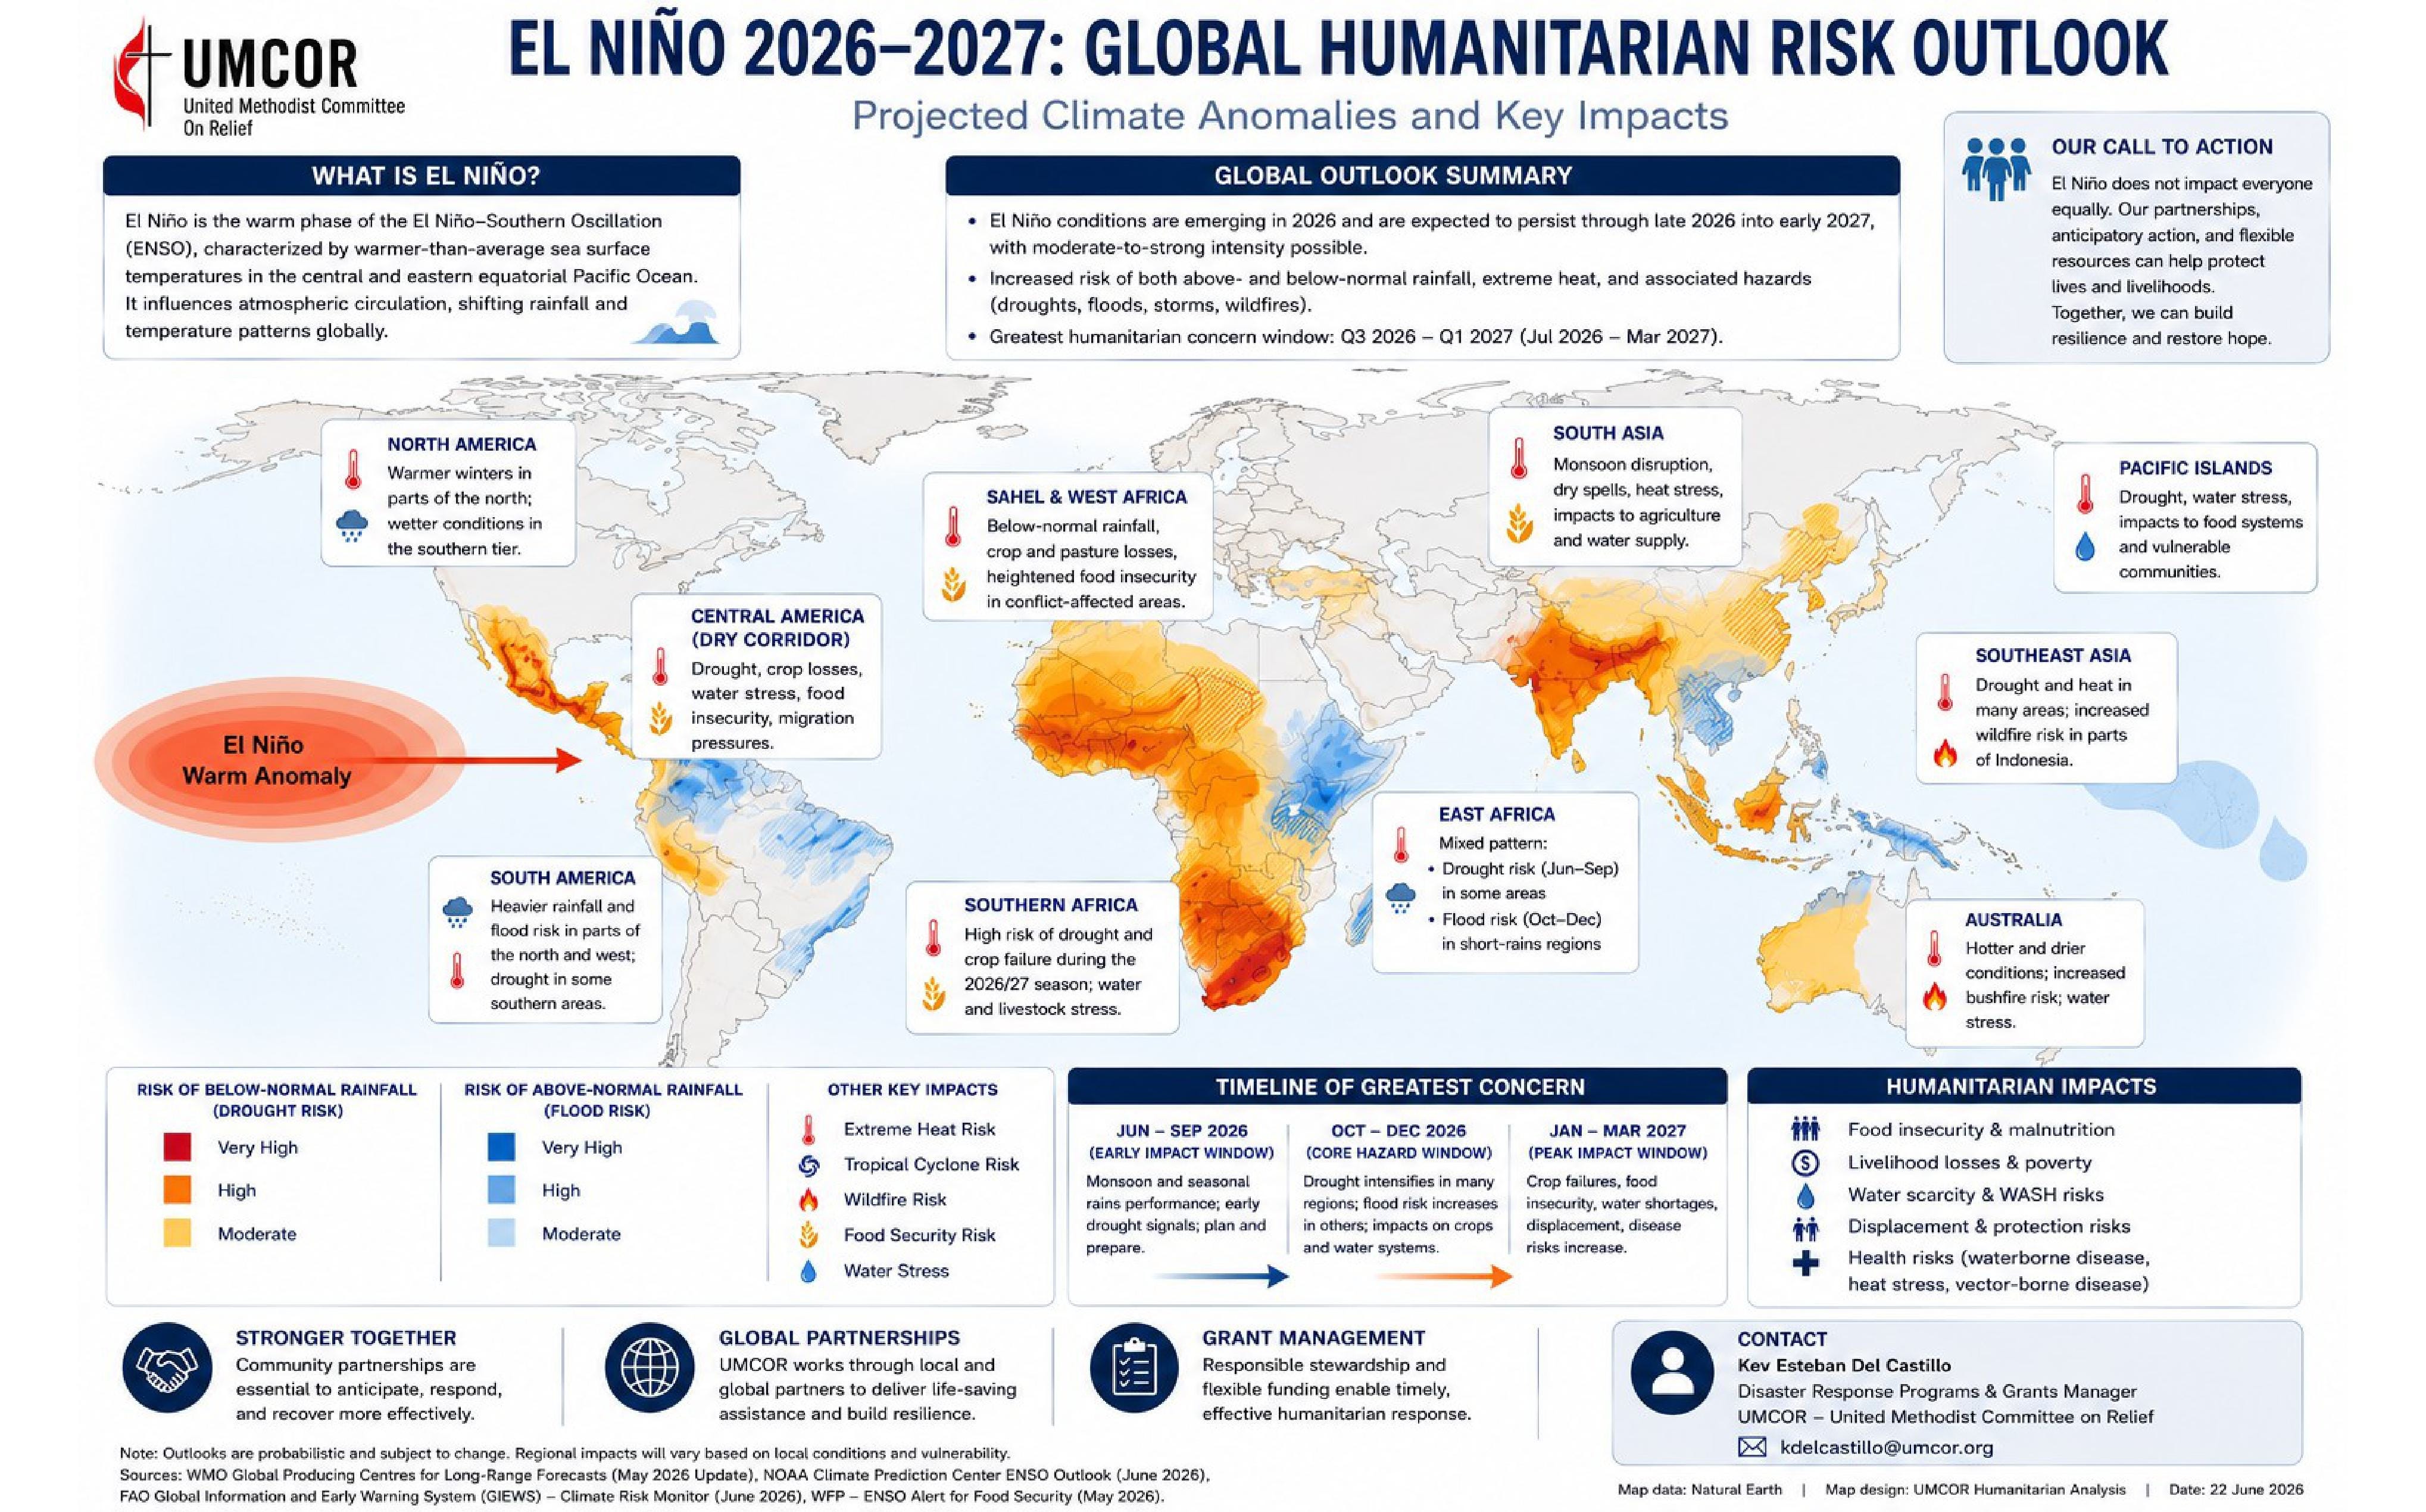
The crop ledger reads one commodity at a time; the humanitarian sector reads one region at a time, and the two converge.UMCOR’s June outlook resolves the confirmed El Niño into a redistribution of drought, flood, and heat across ten regions, with a window of greatest concern from July 2026 through March 2027, exactly the stretch the crop calendar leaves exposed, and a three-phase timeline that is paid out in crop failure, displacement, and disease by early 2027. ¹⁵
The El Nino is coming as aid agencies struggle to provide food for the tens of millions of people in need in Iran, Suda, Gaza, Haiti, Myanmar, Syria and elsewhere.
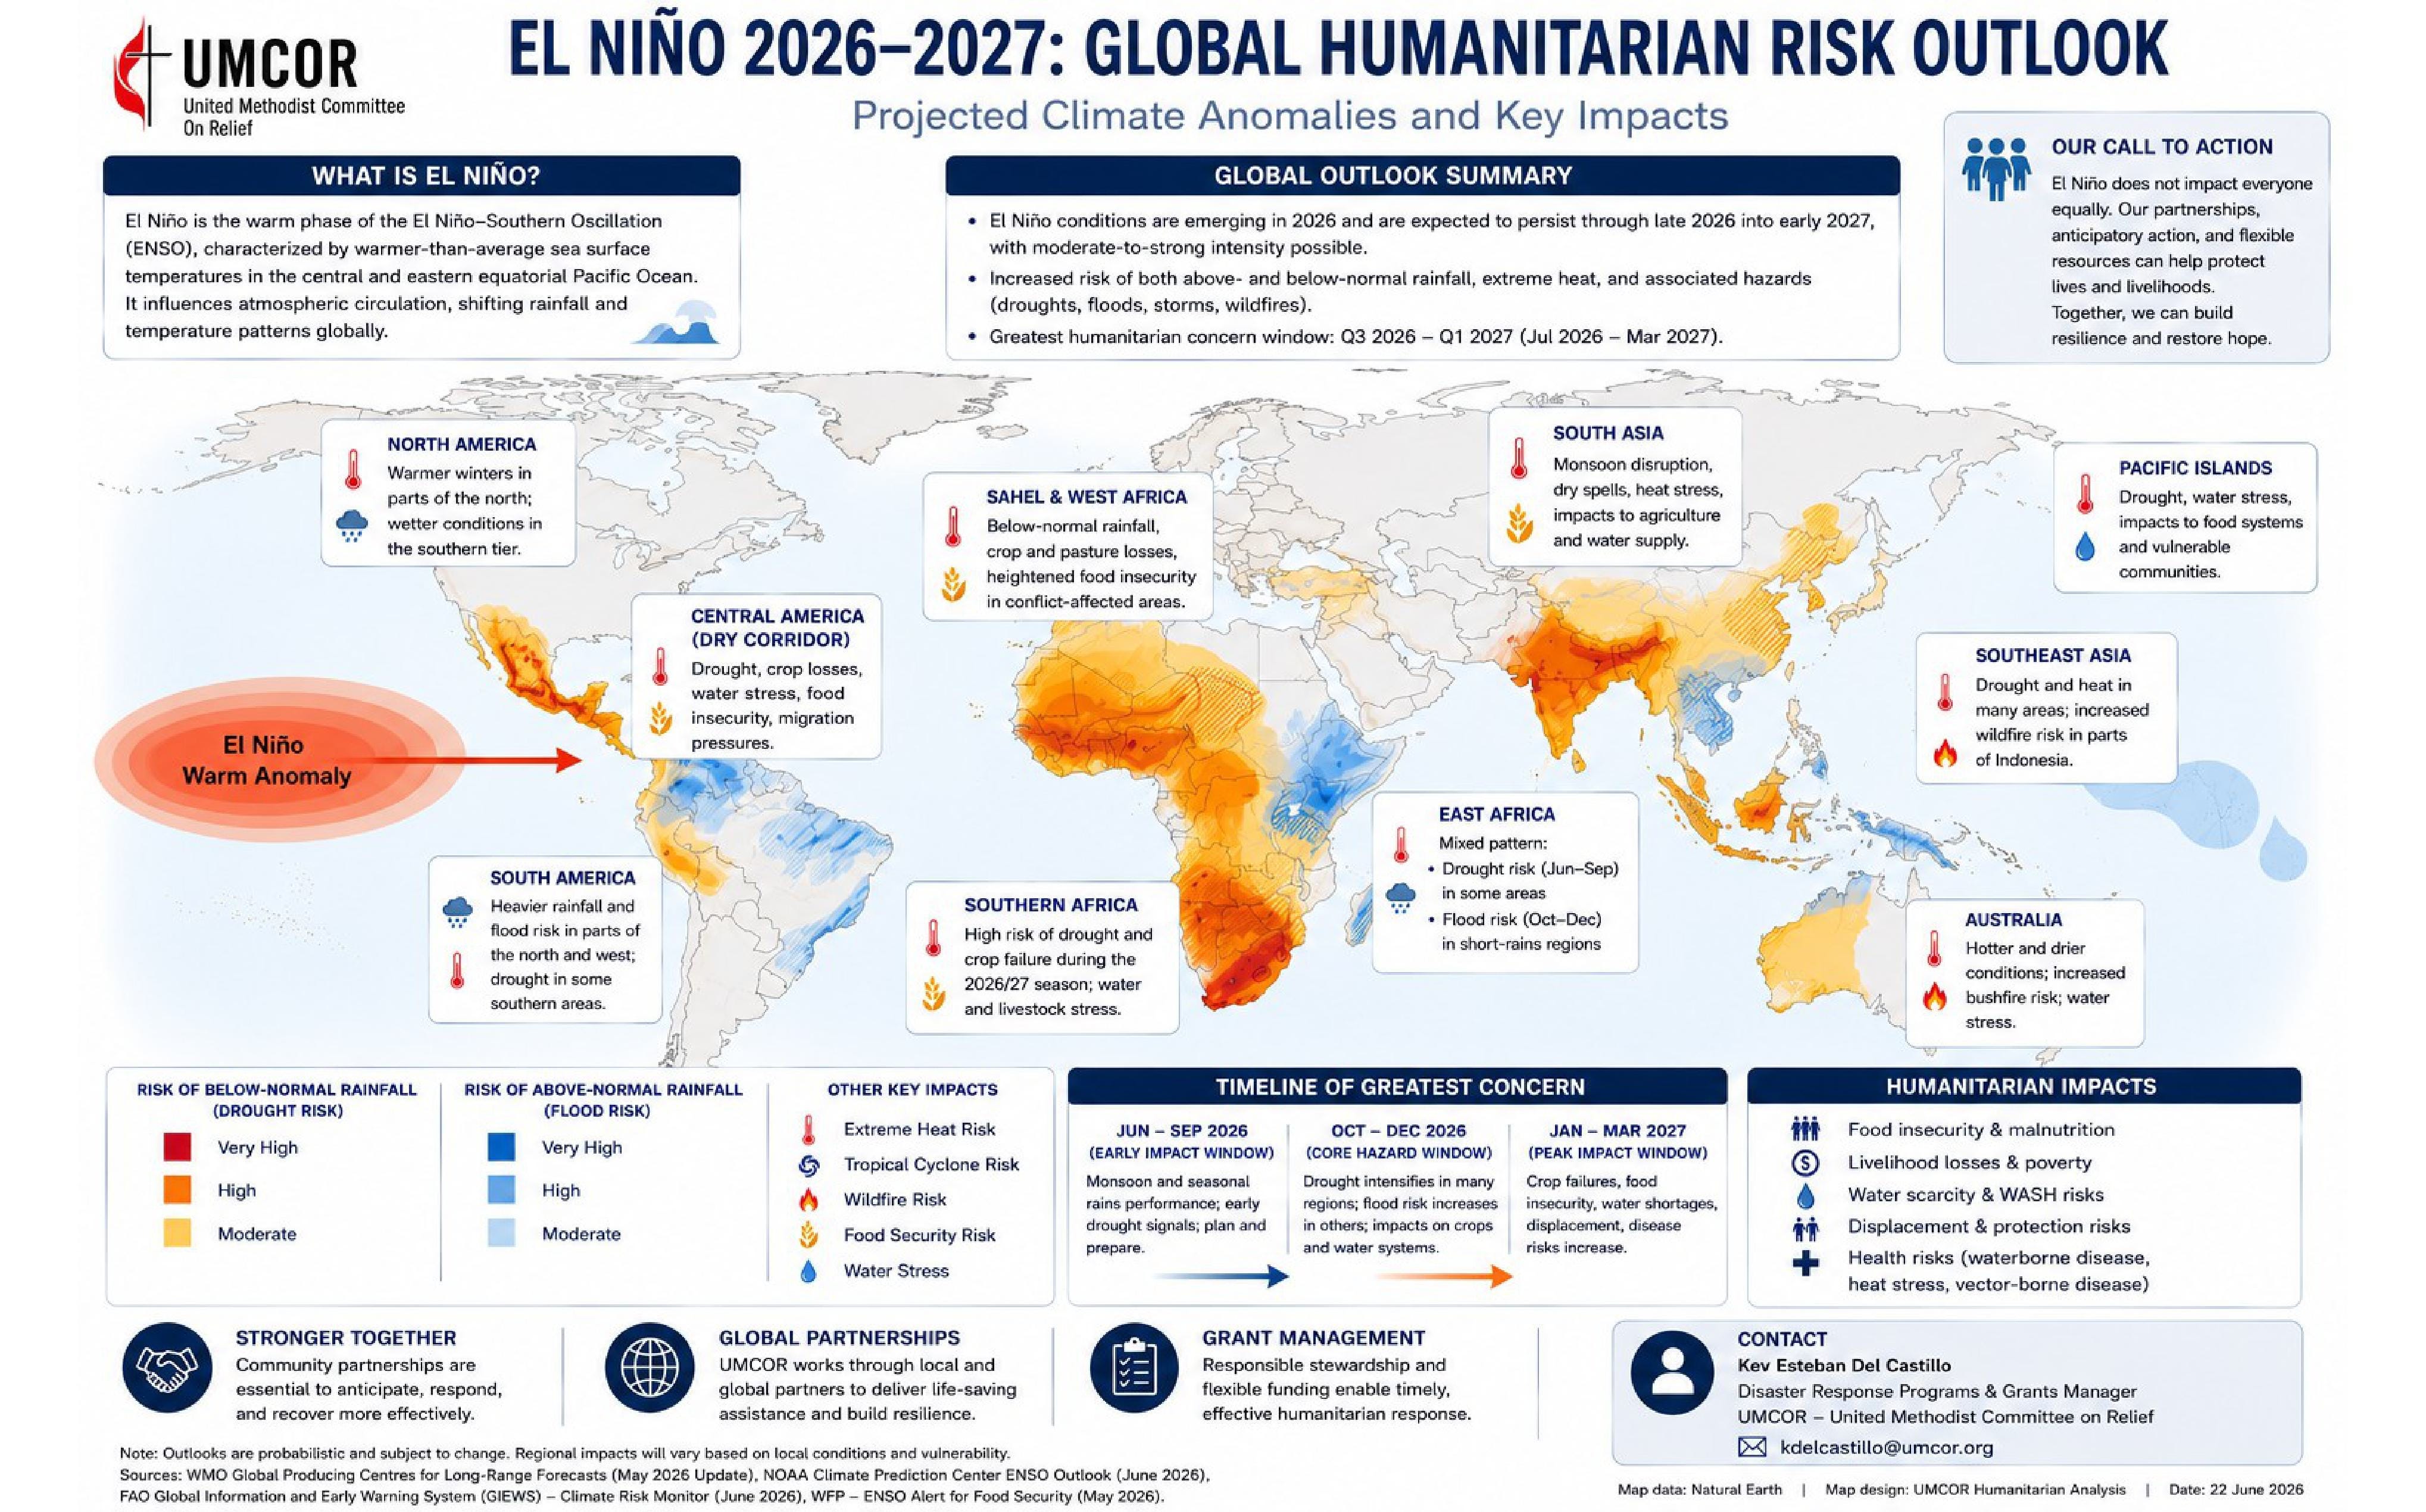
Figure 3. The same second half, drawn as a humanitarian map. UMCOR’s June 2026 outlook resolves the El Niño into a redistribution of drought (reds), flood (blues), and heat across ten regions, with a concern window of Q3 2026 – Q1 2027. Source: UMCOR, drawing on WMO, NOAA CPC, FAO GIEWS, and WFP.
The call for early action arrives in the worst funding environment in a generation. The OECD reported 2025 aid down 23 percent, humanitarian aid down more than a third, and core UN funding down 27 percent after an 87-percent U.S. cut, with the 2026 appeal now reaching barely a third of those in need. The warning is not the problem; money has always moved after the photographs arrive, and the institutions built to change that are the ones being defunded.¹⁶
The scale of that retreat is now measurable, and it is still deepening. The OECD’s preliminary 2025 figures show official development aid falling for a third consecutive year, to its lowest level since 2014, with a further decline of roughly 7 percent projected for 2026 that has barely begun to land. The contraction is strikingly concentrated with the five largest donors accounting for 96 percent of the reduction in aid, led by a 57 percent cut from the United States. The cuts in aid fall hardest where the cushion is thinnest: bilateral aid to the least-developed countries and to sub-Saharan Africa each dropped more than a quarter in 2025 and is forecast to fall by double digits again this year, while global health financing is on course to run as much as 63 percent below its 2022 peak. What remains is being redrawn by geopolitics rather than need, with more aid flowing to Ukraine in 2025 than to all the least-developed countries combined. The humanitarian system downstream is, in its coordinator’s words, “overstretched, underfunded and under attack.” Roughly a fifth (only 20%) of its appeals have been funded this year, and more than 320 aid workers have been killed in a single year. ¹⁷
The humanitarian map of the coming year, shows a redistribution of drought, flood, and heat across five continents and a calendar that says the reckoning arrives after the existing food reserves have already been spent.
How to Read the Ledger Yourself
Every figure here comes from open data updated through the year:Every figure here comes from open data updated through the year: USDA’s Crop Explorer and GEOGLAM for crop condition and the WASDE for official world numbers; the FAO Food Price Index for the split beneath the headline; the ICCO, ICO, and IOCfor the tree and tropical crops; NOAA’s ENSO page and Australia’s Bureau of Meteorology for the El Niño driver; and, at home, the U.S. Drought Monitor and USDA’s weekly Crop Progress.
Endnotes
1. FAO, June 2026: Food Price Index 130.3 (~18.7% below the 2022 peak); 2026 world cereals ~2,983 MMT, the second-largest ever, on comfortable stocks. Source: FAO.
2. FAO sub-indices, June 2026: vegetable oils +~23% y/y (highest since 2022); meat a record 131.0. Source: FAO.
3. Crops: an April flood submerged 46,000+ ha of ripe boro in the Bangladeshi haor (loss ~20% haor / ~10% national); West African cocoa drought during cherelle formation (Ivory Coast next crop seen down to −17.5%) even as futures fell >30% on a glut; FAO oil index highest since 2022; Spain’s smallest orange crop in 16 years (−11.6%); record Brazilian arabica vs drought-hit Vietnamese robusta. Sources: Bangladesh DAE; Fitch; ICCO; FAO; Conab; USDA.
4. Growers: in Bangladesh, 236,000+ families affected and ~214,000 t of rice lost with no replant; Ivory Coast cut its 2026 cocoa farmgate price >50% to ~$2.13/kg; Vietnam’s coffee sector had not recovered from 2023–24 before a confirmed El Niño. Sources: Bangladesh Min. of Agriculture; Reuters.
5. Meat prices and the U.S. herd: the FAO Meat Price Index averaged a record 131.0 in June 2026 (base 2014–2016 = 100), up 4.0% year on year — an index of international export quotations, led in June by poultry (stronger Brazilian prices) and lamb, with global beef and pork easing. USDA-NASS's January 2026 Cattle report put all U.S. cattle and calves at 86.2 million head, the smallest herd since 1951, and beef cows at 27.6 million, the lowest since 1961, in the eighth year of contraction. U.S. retail 100% ground beef averaged about $6.82/lb in June 2026 (BLS); herd rebuilding takes roughly 3–4 years, so tight domestic supply is expected to persist into 2027–2028. Sources: FAO; USDA-NASS (Cattle, 30 Jan. 2026); U.S. BLS.
6. Livestock: camels saw 2026 mortality even in the Horn of Africa; a late-June European heatwave (all but impossible without climate change) killed ~2.5–3M French broilers and cut western French milk ~15–20%; U.S. April lamb ~$262/cwt (+~53% y/y). Sources: BBC; FEWS NET; Le Monde/ANVOL; WWA; MSU.
7. China pork: Q1 2026 output +4.2% to 16.7 MMT; hog price ~11.3 yuan/kg (−27% y/y), an eight-year low, on oversupply not weather; a March directive cut the sow herd (39.6→36.5M) and the state bought reserves. Sources: China NBS; AHDB; SCMP.
8. France/EU maize: France ~9.4 MMT (COCERAL), ~a third below 2025 and according to USDA WASDE, the lowest in 30+ years; COCERAL cut EU+UK grain by 23.4 MMT; EU maize 52.7 MMT, lowest since 2007. Sources: COCERAL; Expana; USDA WASDE.
9. Kenya/sugar/China grain: USDA cut Kenya’s 2026 maize on a June dry spell (some ~a third below average); BofA sees Brazil–Thailand sugar −10% in 2026/27; China took a record 2025 harvest (~715 MMT) into 2026 and cut corn imports ~90%. Sources: USDA; Bank of America; SunSirs; FAO.
10. Southern Hemisphere: Australia’s dry autumn cut canola area ~32% and NSW wheat ~13%; national wheat ~26.7 MMT for 2026–27 (vs ~36), with record cattle sell-offs; Argentina soy held ~48 MMT after a scare; Brazil banked a record ~180 MMT soy crop with safrinha corn at risk. Sources: ABARES; DTN; Kpler; USDA FAS.
11. Midyear balance: shocks concentrated in crops least able to average out with flood-prone rice, tree crops, tropical specialties being hit the hardest while grain aggregates held on a record 2025 harvest and full reserves. Source: FAO.
12. El Niño: on 11 June 2026 the U.S. CPC issued an El Niño Advisory (observed; >96% chance of persisting), with a Nov 2026–Jan 2027 peak, ~63% odds of a “super” event and a pooled peak near +3.6°C — the strongest on record if realized. Sources: NOAA CPC; WMO.
13. Forward risks and southern Africa: a severe event could cut Philippine rice 25–35%; India’s monsoon ~92% of average with its sugar ban expected to hold; Indonesia+Malaysia hold ~88% of palm oil on thin stocks. Southern Africa’s maize peaks with the El Niño, but two La Niña years left near-record stocks (food inflation ~3.2% vs 10.8% in 2016), so a drought should bite more softly. Sources: PAGASA; IMD; Marex/Helios; S&P Global.
14. Scenarios: from a mild close (regional specialty shocks over intact grains) to a central strong-to-very-strong case (reduced Australian wheat, cushioned southern African maize, tighter palm/sugar, a second leg up in oils into 2027) to a severe case in which shocks outrun reserves, pressuring the ~333M already in acute food insecurity. Sources: NOAA CPC; USDA; WFP.
15. UMCOR: “El Niño 2026–2027: Global Humanitarian Risk Outlook,” 22 June 2026, on WMO/NOAA/FAO/WFP guidance; concern window Q3 2026–Q1 2027 across ten regions, in three phases ending in peak impact (Jan–Mar 2027: crop failure, displacement, disease). Source: UMCOR.
16. Funding: OECD reported 2025 aid −23.1% (steepest ever), humanitarian aid down >a third, core UN funding −27% (an 87% U.S. cut after USAID’s dismantling); the 2026 Iran war diverted money; the UN’s $33bn 2026 appeal reaches barely a third of those in need. Sources: OECD; UN OCHA; CERF.
17. The current state of international aid: the OECD’s preliminary 2025 data (April 2026) show DAC official development assistance fell 23.1% to $174.3 billion , the steepest drop on record and a third consecutive annual decline, its lowest level since 2014, with a further ~6.9% projected for 2026; the five largest donors account for 96% of the fall, led by the United States (−57%). Bilateral aid to least-developed countries and sub-Saharan Africa fell 25.8% and 26.3% in 2025 and is projected to drop a further ~10.9% and ~11.6% in 2026, while health financing is projected as much as 63% below its 2022 peak. DAC members’ 2025 aid to Ukraine exceeded their combined aid to all least-developed countries. The UN’s 2026 Global Humanitarian Overview seeks $33 billion for 135 million people after 2025 funding hit a decade low (~$12–15 billion) and reached 25 million fewer people; UN relief chief Tom Fletcher called the system “overstretched, underfunded and under attack,” with only about 20% of appeals funded and more than 320 aid workers killed in 2025. Sources: OECD (Preliminary 2025 ODA Data; ODA Projections for 2026, April 2026); UN OCHA (Global Humanitarian Overview 2026); The New Humanitarian.
I am especially gratefull dear Mark for your focus on the risks, for the poorest. Overall; the absurdity in the midst of both - so many people more wealthy than ever before plus the hunegr alarms, and the climate beating records; to be beaten. We are I N the beginning of a global climateemergergency; and by now over 2 5 0 0 0 0 people evacuated in Spain and france; crops and wildlife lost each second... Yet still. ... Well. Earth Science and I declare CLIMATEEMERGENCY ! Ill share the part with the risks here, and join everyone who cares. : https://www.facebook.com/profile.php?id=61565699637497
The real problem is not ElNinio, but the fact that sufficient food stocks are not created as security for crises. A large volcanic eruption, like Krakatoa, could easily lead to a 50% crop loss in the following two years. And at some point something like this will happen again. It would cost just 1% of the gross national product if one were to build up a grain supply spread over 10 years that could feed everyone for a year (around 400 kg/person). We currently rely on derivatives and global trade to hedge risk. This can cushion small crises quite well. But since fewer reserves are held, this makes a major loss of production that much worse. And the world itself can produce more than enough food. But in agriculture the response time is typically at least a year! Therefore, you should take appropriate precautions. And then you can easily absorb regular events like ElNinio.