

The Inches of Sea Level Rise That Eat Farms
The shoreline is not where you think it is. To a geologist, a tide gauge analyst, or a corn farmer staring at a field going white with salt crust, the shoreline has been moving inland for decades, measured in millimeters of sea-level rise per year, at a pace easy to dismiss until suddenly it is not. Across the coastal plains of Maryland, Virginia, Delaware, North Carolina, and Louisiana, relative sea level rise (RSLR) is converting the most productive agricultural land in the region into salt marsh, at a rate that no crop rotation schedule and no drainage ditch installation can fully outpace.
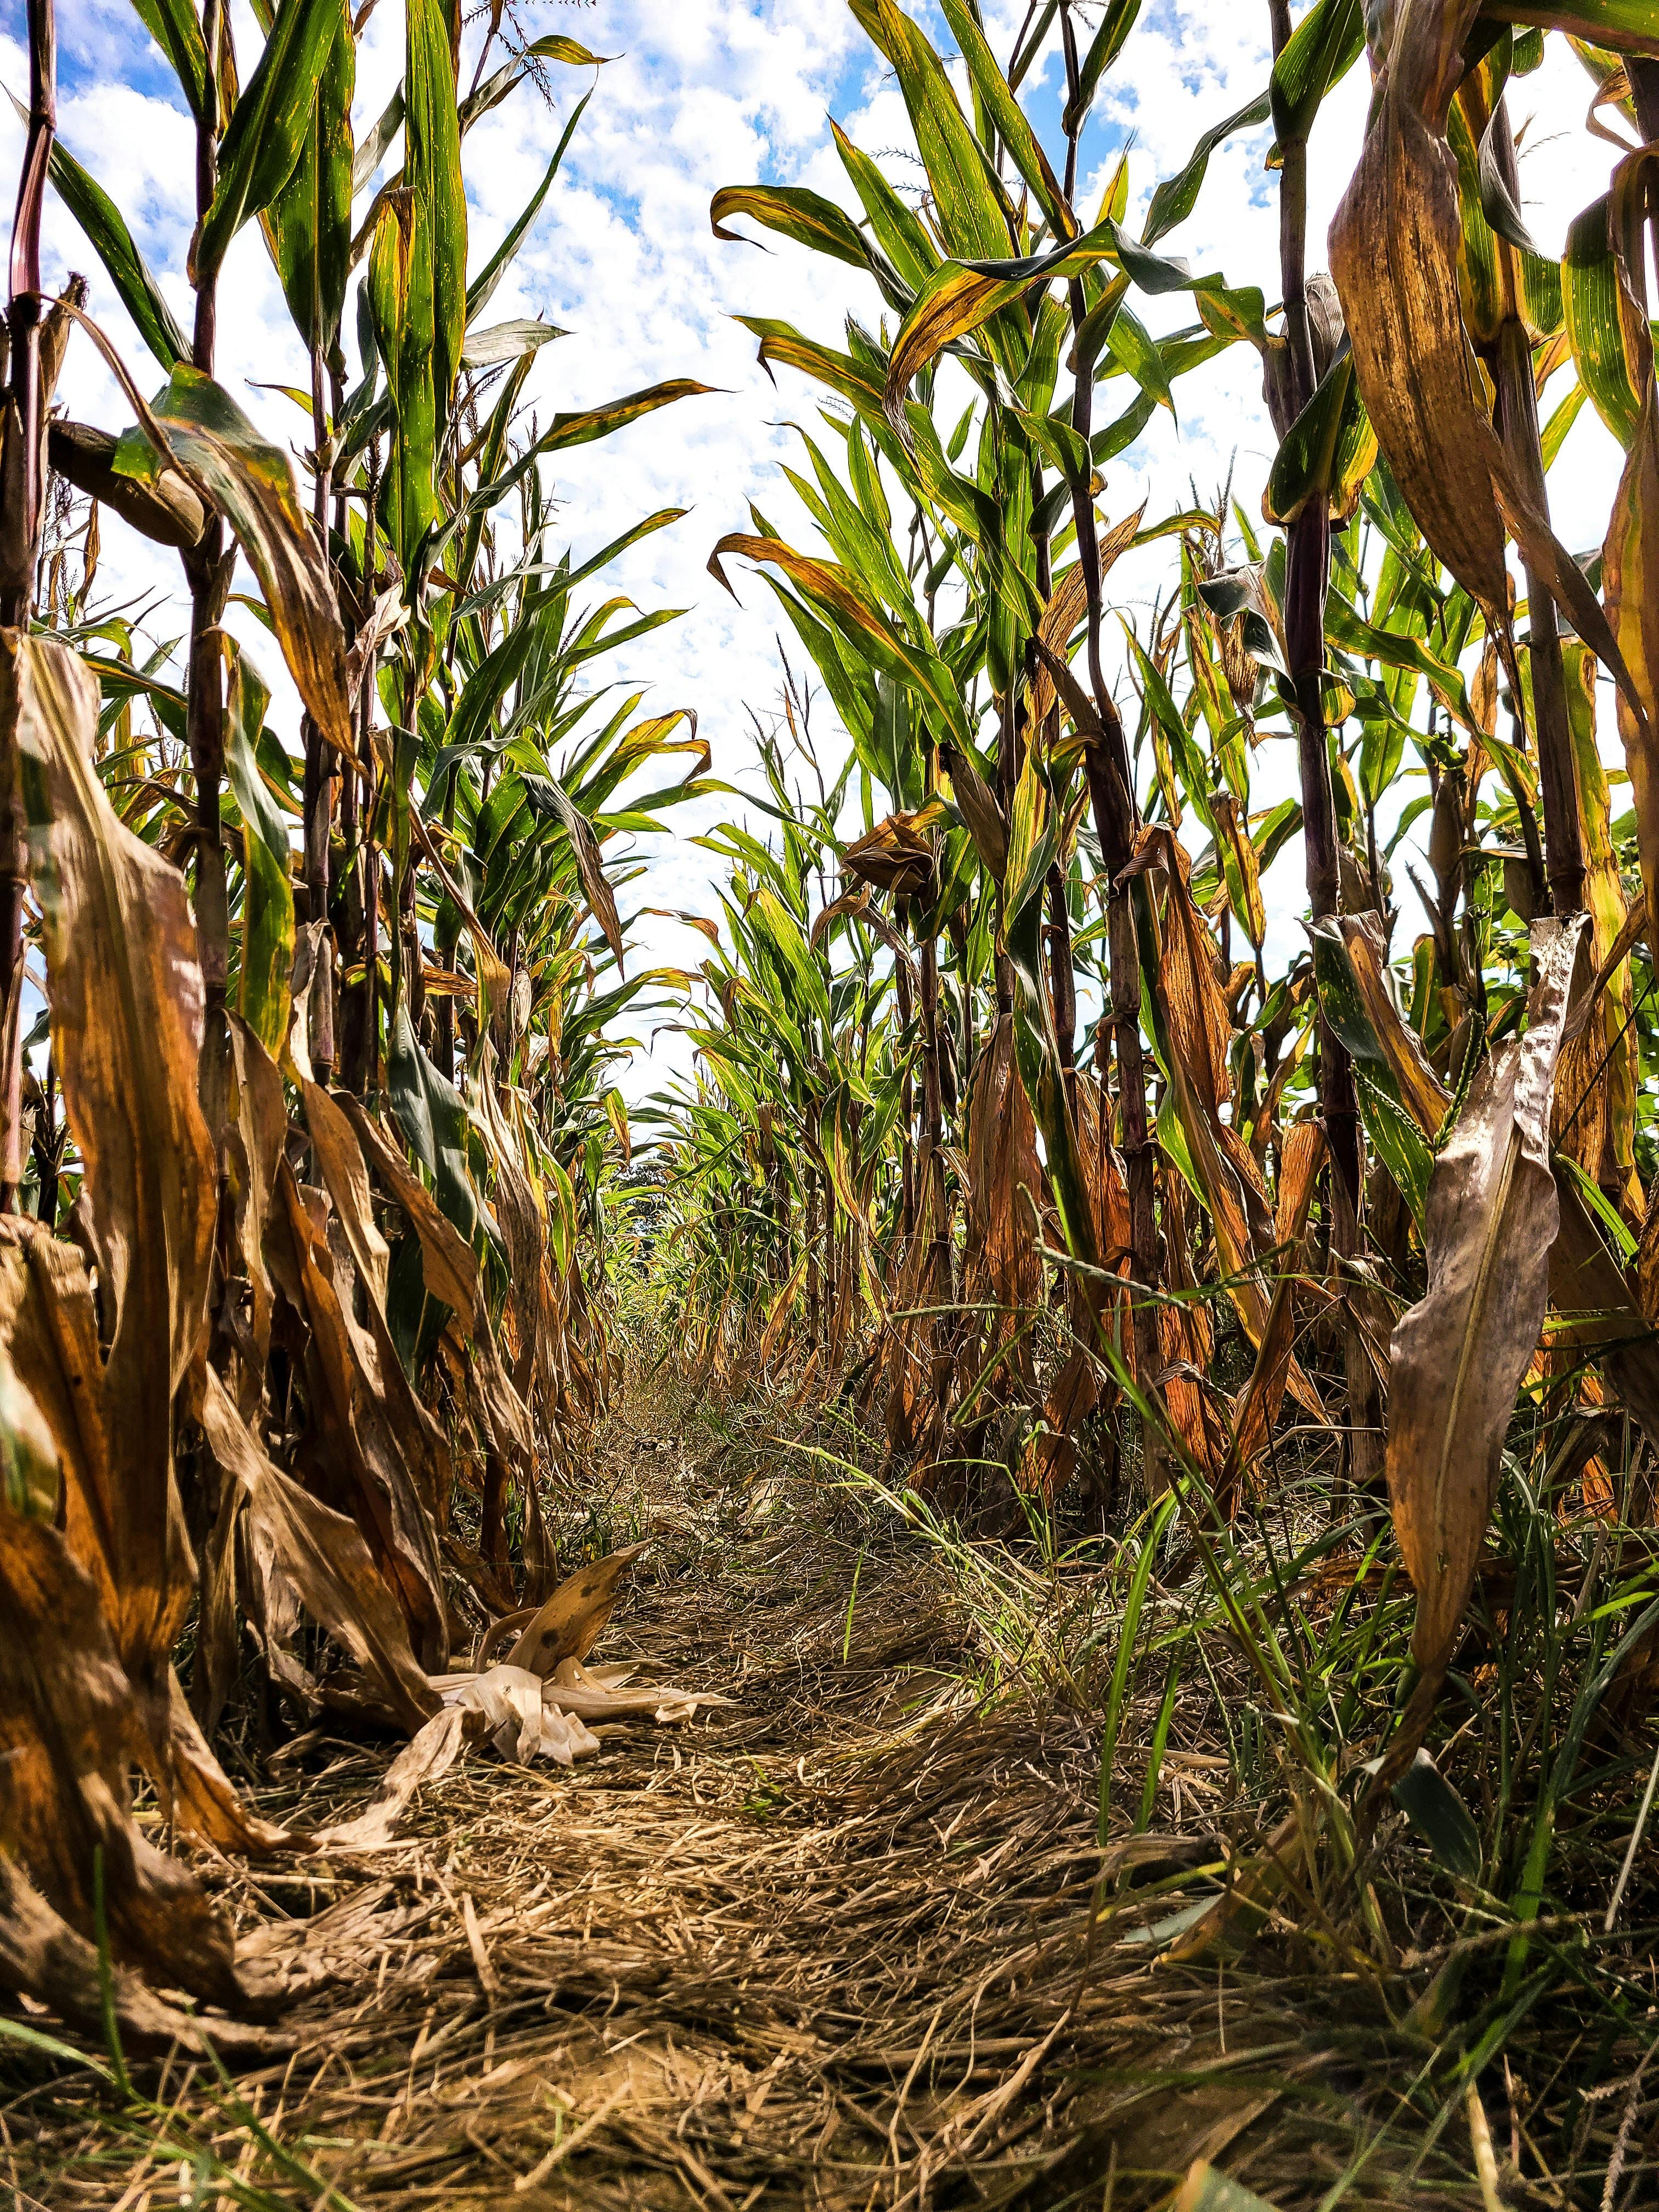
Photo credit: Shonna Franks
Over the three decades between 1993 and 2023, global mean sea level rose a cumulative of 101.4 mm, approximately four inches at a mean rate of approximately 3.6 mm rise per year.1 That is already double the twentieth-century long-term average of 1.4 mm rise per year.2 By 2024, tide gauge records across the contiguous United States recorded that the rate of sea-level rise had increased to a localized rate of approximately 4.3 mm per year, accumulating nearly 16 inches of relative sea level rise since 1900.3 Those numbers sound modest in the abstract. They are not modest on a farm.
This is not a crisis arriving someday, it is a crisis that has arrived today. A landmark multi-decadal study using 38 years of satellite imagery across the Mid-Atlantic found that sea marsh encroachment is nearly twice as fast, and 1.4 to 6.8 times more frequent on agricultural lands than on adjacent forestlands.4 Between 1984 and 2022, the seaward boundary of agricultural land across the Chesapeake and Delaware Bay watersheds moved upslope from an elevation of 0.74 meters to an elevation of 0.87 meters.5 That is not a natural shift in plant communities. That is the ocean claiming farmland, acre by acre, year by year, in the most productive coastal agricultural region in the eastern United States.
Fine-scale mapping of the coastal counties of Delaware, Maryland, and Virginia that was published in Nature Sustainability reveals that the land area covered by visible salt patches almost doubled between 2011 and 2017 alone, converting over 19,000 acres of working farmland into salt marsh.6 The direct economic losses to farmers from those visible salt patches exceeded $427,000. The indirect losses from reduced crop yields within 200 meters of salt patches are estimated at $39 million to $70 million annually.7 In Somerset County, Maryland, 3.5 square kilometers of agricultural land transitioned entirely to tidal wetland between 2009 and 2017.8 Across the broader region, cumulative farmland losses between 1984 and 2022 reached 557.4 square kilometers, 14.8 percent of total agricultural area, outpacing even the loss of forestland, despite the fact that farmland sits, on average, at higher elevations than the forests it is losing ground to.9
“The shoreline is not where you think it is. It has been advancing inland for decades, measured in millimeters per year, at a pace easy to dismiss — until the salt patches appear, the corn dies, and the marsh moves in.”
The sea does not only advance at the surface. It advances underground. Saltwater intrusion moves through both tidal channels and subsurface aquifers, reaching fields miles from any visible coastline. The dense networks of drainage canals and ditches that coastal farmers have built over generations to keep their fields workable by alleviating waterlogging and getting crops in the ground on schedule are, at the regional scale, the very infrastructure that accelerates the problem of salt water intrusion due to sea-level rise. Those low-resistance hydrological pathways are highways for high tides and storm surges, carrying saline water miles inland, into fields that should be freshwater systems.10
What Salt Does to a Farming Soil
When saltwater reaches an agricultural field, it does not merely wet the soil and drain away. It begins a sequence of biogeochemical processes that can permanently degrade the land’s productive capacity. The introduction of salt water, which is made of sodium (Na⁺) and chloride (Cl⁻) ions, into the soil solution of farmlands increases its osmotic potential, making it difficult for non-salt-tolerant crops to extract water even from soils that are technically saturated with water.11Specific ion toxicities caused particularly from chloride stunt crop growth, disrupt photosynthesis, and cause necrotic leaf burn, defoliation, and complete germination failure. For a corn farmer, that is the end of a season potentially leading to bankruptcy1111.
Beyond those immediate crop effects, the sodium ions attack the soil structure itself. In sodic conditions, where Na⁺ saturates the cation exchange capacity of clay minerals, soil aggregates disperse. The macropore network that makes soil a functional medium for plant roots and drainage collapses. Hydraulic conductivity falls. The ground seals. The water sits. And when the water sits long enough, a sequence of microbial transformations begins from which the field may not recover.12
In a healthy coastal agricultural soil, significant stores of organic carbon are stabilized by binding to iron oxides in a process called mineral-associated organic matter (MAOM) formation. When saltwater intrusion creates anoxic, waterlogged conditions, anaerobic microbes use those iron compounds as substitute electron acceptors in their respiration, dissolving them in the process. That dissolution releases the associated organic carbon, which is rapidly mineralized into carbon dioxide and methane.13 A historical carbon sink becomes an active greenhouse gas source. Making climate change and sea-level rise worse. The soil’s nutrient-cycling capacity collapses along with its structure. Elevated chloride concentrations directly inhibit the nitrifying bacteria that convert ammonium to the nitrate forms that crops can use, making fertilizer applications increasingly ineffective.14
The Corn Economy and Its Salt Threshold
The economic stakes of this biogeochemical cascade are particularly severe for the Delmarva region and the broader coastal Mid-Atlantic because of its deep dependence on corn production. Corn is, by the measure of salt tolerance science, the most vulnerable of the major commodity crops. The Maas-Hoffman model, the foundational salt tolerance framework used by agricultural extension services and resource managers across the United States, defines the relationship between soil salinity and relative crop yield. For corn (Zea mays), the damage to crops from salt water begins at an electrical conductivity of the saturated soil extract of just 1.7 decisiemens per meter, a measurement that is the lowest threshold of any major commodity crop in production on the coastal plain.15
All other major crops can with stand much greater salt water damage: 1) barley (threshold: 8.0 dS/m), 2) wheat (6.0 dS/m), or even 3) sorghum (6.8 dS/m).16 In states like North Carolina, where saltwater intrusion is advancing through the low-lying agricultural landscapes of the Outer Coastal Plain, farmers are being forced off corn and onto lower-value sorghum. The farmers are making this change, not because they want to, but because the salt in their fields leaves them no choice. The margin compression in those communities, already economically vulnerable, is severe. Global annual economic losses from salt-degraded agricultural land are estimated at between $12 billion and $27.3 billion from reduced crop yields alone.17 The value of the lost farm land is multiples of that loss.
This slow-onset disaster extends far beyond the Mid-Atlantic. Ocean water is encroaching on freshwater aquifers in 43 states, destroying irrigation sources and introducing structural vulnerabilities to regional agricultural supply chains.18 The stakes reach their highest in California’s Sacramento-San Joaquin Delta, which serves as the freshwater hub for 20 million residents and irrigates the Central Valley, a region that produces more than half of the nation’s fruits, nuts, and vegetables. The question of whether that system remains a freshwater system is a question about whether California’s agricultural economy survives in its current form.19
“American farmers are being asked to absorb a geological and hydrological crisis they did not create, on top of a climate crisis driving the same saltwater intrusion, in communities that were already watching their margins thin and their neighbors sell.”
The Fisheries Crisis That Starts in a Marsh
The ecological and economic destruction of relative sea level rise does not stop at the farm field’s edge. It extends into the estuaries and nearshore ecosystems that serve as the biological engines of the American commercial fishing and shellfish industries. At least 50 percent of all commercially harvested fish and shellfish species in the United States, including shrimp, blue crabs, eastern oysters, menhaden, weakfish, and a range of demersal finfish, rely on estuaries and intertidal salt marshes as nursery habitats.20 The wave-buffering capacity of those wetlands prevents an estimated $3 billion in storm damage annually.21 Both of those functions are in accelerating decline.
According to the U.S. Fish and Wildlife Service’s decadal Wetlands Status and Trends report to Congress, measuring change between 2009 and 2019, the contiguous United States lost 670,000 acres of vegetated wetlands, an area roughly the size of Rhode Island.22 Salt marshes experienced the largest net percentage reduction of any saltwater wetland category, declining by 2 percent or 70,000 acres.23 That loss rate represents a 50 percent increase from the 2004–2009 study period. The trajectory is accelerating, not stabilizing.
Under natural conditions, salt marshes maintain their relative elevation by trapping sediment and accumulating organic peat. When sea level rise outpaces that vertical accretion, marshes migrate landward, colonizing low-lying uplands. But along the developed Atlantic and Gulf coastlines, that landward migration is blocked by seawalls, bulkheads, roads, and development in a phenomenon ecologists call coastal squeeze. Within the United States, approximately 14 percent of all shorelines have been hardened with artificial structures.24 Those structures do not merely protect the land behind them. They sentence the marsh in front of them to drowning. Systematic reviews published in BioScience document that seawalls support 23 percent lower biodiversity and 45 percent lower organism abundance than natural shorelines.25 The juvenile fish and shellfish that depend on that margin habitat have nowhere to go.
The Scallop Fleet, the Oyster Reef, and the Chemistry of Collapse
For marine species that have shells including oysters, scallops, clams, crabs, the physical threat of coastal squeeze is compounded by ocean acidification (OA). The ocean has absorbed roughly 30 percent of the anthropogenic carbon dioxide emitted since industrialization began in about 1850.26 That carbon dioxide has seriously impacted the marine carbonate system, reducing the concentration of carbonate ions and lowering the saturation state of calcium carbonate, including aragonite and calcite, the minerals shellfish use to build and maintain their shells. The result, for larval oysters and juvenile scallops, is thinner shells, higher predation mortality, and mass die-offs in commercial hatcheries during acidification events.27
The Atlantic sea scallop fishery, worth over $500 million annually, is the largest wild scallop fishery in the world and represents 77 percent of the commercial landings value of New Bedford, Massachusetts, America’s highest-value fishing port.28 A landmark bioeconomic model published in PLOS ONE by Rheuban et al. (2018) projects that under a high CO₂ emissions scenario, wild sea scallop biomass may decline by more than 50 percent by the end of this century, with landings contracting by 10 to 30 percent as early as 2050.29 The offshore fleet operating out of New Bedford, Gloucester, and Point Judith is not a distant abstraction of biodiversity loss. It is real people, real boats, and real communities whose economic futures are written in the chemistry of water they cannot change.
On the Pacific coast, ocean acidification has already cost the aquaculture sector an estimated $110 million and 3,200 jobs.30 The Whiskey Creek hatchery in Oregon historically has supplied 75 percent of West Coast oyster larvae. It has experienced catastrophic larval mortality events tied directly to acidification before installing monitoring and buffering systems that partially restored production. In Alaska’s Bristol Bay, the NOAA Ocean Acidification Program documents OA as a primary driver of long-term red king crab decline, contributing directly to the complete commercial fishery closures during the 2021–2022 and 2022–2023 seasons.31 Those closures did not merely hurt fishers. They erased the economic foundation of remote coastal communities that have no alternative industry to fall back on.
The Eastern oyster industry, generating approximately $250 million annually along the Gulf and Atlantic coasts, is suffering from the convergence of salinization, reef erosion, and acidification, disrupting the physiological cues that govern spawning and juvenile settlement.32 Projections indicate that an intermediate sea level rise of 1.2 meters by 2100 will eliminate 83 percent of existing coastal marshes and 26 percent of seagrass beds across the Mid-Atlantic shelf, leading to steep declines in commercial catches of blue crabs and shrimp.33 The marine food production ecosystem of the American eastern seaboard is being dismantled, one lost inch of marsh, one acidified larval cohort, one closed fishery at a time.
The Pathogen Nobody Talks About Until People Die
Relative sea level rise is not only dissolving wetlands and collapsing fisheries. It is also expanding the geographic range of one of the most lethal bacterial pathogens in the American food supply. Vibrio vulnificus is a halophilic, gram-negative bacterium that occurs naturally in warm, brackish estuarine waters. It is the leading cause of seafood-related deaths in the United States, responsible for 95 percent of all domestic seafood-associated fatalities, primarily through the consumption of raw oysters.34 Its clinical mortality rate from primary septicemia ranges from 15 to 50 percent.35 It is not a marginal risk. It is a serious and growing public health crisis whose geography is being actively redrawn by sea level rise.
The proliferation of V. vulnificus is tightly constrained by two environmental parameters: water temperature (16°C to 33°C) and salinity (5 to 20 parts per thousand). Historically, the optimal brackish salinity corridor was confined to the middle reaches of tidal estuaries. The fresh reaches upstream were too fresh; the coastal ocean boundaries too saline. As rising seas push the salt wedge upriver, that optimal corridor migrates into formerly freshwater reaches of coastal rivers, dramatically expanding the volume of water capable of hosting high pathogen concentrations.36
Empirical modeling demonstrates that sea level-driven shifts in salinity gradients have a significantly greater impact on future V. vulnificus exposure risk than atmospheric temperature increases alone.37 In estuaries such as Winyah Bay, South Carolina, predictive models indicate that SLR-driven salinity shifts will increase exposure risk by up to four times, with the most severe increases occurring at upriver sites that currently face zero baseline risk.38 This range expansion is already manifesting clinically. Cases and fatalities are emerging in Long Island, Connecticut, and Rhode Island - regions historically considered too cold and too fresh to support dense Vibrio populations. Following the coastal flooding of Hurricane Ian in 2022 and Hurricane Helene in 2024, Florida reported unprecedented spikes in vibriosis, with over 74 cases and 17 deaths in counties flagged as high-risk by predictive models.39
“The fish are moving north. The salt is moving inland. The bacteria are following the salt. And the fishing communities cannot move at all — constrained by their boats, their docks, their debt, and the only place they have ever called home.”
The Regulatory Cost of a Warming Bay
Because of the lethality of V. vulnificus, federal and state regulators impose strict sanitary controls on the commercial shellfishery under the National Shellfish Sanitation Program (NSSP) and the FDA. These mandates enforce operational and post-harvest protocols that are non-negotiable and increasingly expensive. Oysters harvested for raw consumption must be placed under mechanical refrigeration within 10 hours of harvest to keep internal temperatures below the pathogen growth threshold.40 In an unrefrigerated transport vehicle, Vibrio levels can double in fewer than 15 minutes on a warm summer day. States are legally required to implement a Vibrio Control Plan if two or more confirmed V. vulnificusinfections occur within the preceding 10 years. When case thresholds are exceeded, implicated harvest areas are closed for 7 to 21 days, and oysters must test below 10 pathogenic bacteria per gram of meat before reopening.41
Post-harvest processing techniques like high-pressure processing, irradiation, low-temperature pasteurization, flash-freezing all reduce Vibrio densities and cut oyster-associated illnesses by 40 to 60 percent, but they require significant capital investment that is out of reach for many small-scale coastal producers.42 The regulatory burden is not unreasonable, given what the pathogen does. But it lands hardest on the waterman operating out of a small lease on a tidal creek, not on the industrial processor with a capitalized processing facility. As sea level rise expands the Vibrio risk zone upriver and northward, more harvest areas, more operations, and more communities face those compliance costs and closure exposures.
The Fish Are Moving, But the Boats Cannot Follow
Climate-driven restructuring of marine ecosystems is not merely a future projection. NOAA bottom trawl survey data from the Northeast Shelf, compiled over nearly 50 years, documents an average species distribution shift of almost 8 miles northward and 8 feet deeper per decade.43 The fish are moving to stay within their physiological thermal envelopes, following the isotherms as warming pushes them poleward and into deeper, colder waters. The boats, the processing plants, the fish houses, and the docks cannot follow. They are fixed to geography and capital in ways that fish are not.
This spatial mismatch between migrating stocks and stationary infrastructure is documented in studies of Florida fishing communities including Cedar Key, Conch Key, and Fort Myers Beach.44
These communities, the fishers that work there report with consistent and sometimes painful specificity the regular tidal flooding of main coastal roads, a significant northward migration of warm-water species like snook, the complete disappearance of historically productive shallow oyster reefs, and a one-month delay in the arrival of the annual winter cold front that once structured the clamming and oystering calendar.46 The reefs are gone. The road floods. The cold front is late. The economic loss accumulates.
Who Bears the Weight: The Communities on the Receiving End
The communities experiencing these losses include the coastal agricultural counties of the Delmarva Peninsula and the North Carolina Outer Coastal Plain, the fishing communities of the Gulf Coast and the Chesapeake Bay, the small-scale shellfish growers of the Pacific Northwest and Maine. These are not communities with the greatest capacity to absorb systemic economic shocks. They are rural. They are often economically marginalized. Their tax bases and public services are thin. When a principal industry is degraded by a slow-onset climate change driven geophysical process that receives no emergency declaration and mobilizes no disaster fund, there is no cavalry coming.
The national food security consequences of the losses already documented are significant. Saltwater intrusion is encroaching on freshwater aquifers in 43 states, threatening irrigation systems across a far broader geography than the Atlantic coastal plain.47 The degradation of the Chesapeake Bay watershed’s productive agricultural and aquatic ecosystems is a degradation of a regional food system that feeds millions. The collapse of the Mid-Atlantic marsh edge is a collapse of the nursery habitat that sustains commercial fishing from Maine to Florida. These are not local losses. They are national vulnerabilities being slowly accumulated, one acre and one season at a time.
“The coast is not a boundary between land and water. It is the most productive interface in American food production and it is being disassembled, one marsh acre, one salt patch, one closed fishery at a time, by a crisis whose pace makes it easy to ignore until it is too late.”
What Must Change: Policy Proportionate to the Threat
The political response to the accelerating damage to the American coastal agriculture and fisheries has been pathetic compared to the threat nor well-matched to its geography. There is no shortage of knowledge about what is happening or what works to fix it. The failure is taking that knowledge and creating well funded, scaled, and sustained policy action.
I. Protect and Expand the Agricultural Conservation Easement Program
The USDA Natural Resources Conservation Service administers the Agricultural Conservation Easement Program (ACEP), including its Wetland Reserve Easements (WRE) component, which compensates farmers to voluntarily retire salt-degraded agricultural land from production and restore it to functioning wetland. The program works.48 It is competitive and chronically underfunded, leaving many of the most vulnerable coastal farmers without options when their field become damaged by sea-level rise. State departments of agriculture along the Atlantic and Gulf coasts should establish matching grant programs to supplement federal ACEP enrollment, ensuring that farmers facing the most acute salinization pressures have a viable path to retirement that does not require walking away from land their families have worked for generations without compensation.
Under permanent easements, the NRCS compensates landowners at 100 percent of easement value and covers 75 to 100 percent of restoration costs.49 The 30-year and term easement options offer compensation at 50 to 75 percent of the permanent rate for landowners who are not ready to make a permanent commitment.50 These programs align short-term farm income with long-term ecological retreat, providing a dignified off-ramp from a crisis that, without this program or something similar, will leave farmers with degraded land, no income, and no compensation.
II. Publish Standardized Assisted Marsh Migration Protocols
When salt-degraded farmland transitions to tidal wetland, the process can be managed or it can be chaotic. Assisted marsh migration, the deliberate facilitation of inland wetland expansion through landform modification, invasive species removal, and native planting produces ecologically functional wetland habitat faster and with greater species diversity than unassisted transition.51 Federal and state agencies should publish standardized technical guidelines establishing clear criteria: restricting assisted migration to sites with slopes below 1 percent; requiring the excavation of hydrological runnels to prevent upland ponding that drowns colonizing vegetation; mandating exclusion of contaminated brownfield sites from migration corridors. The USDA NRCS Cape May Plant Materials Center has documented the native species best suited for these buffer zones, including groundsel (Baccharis halimifolia), bayberry (Morella pensylvanica), salt meadow cordgrass (Spartina patens), and switchgrass (Panicum virgatum).52 That knowledge exists. The standardized protocols to disseminate it broadly do not.
III. Rebuild Living Shorelines and Stop Incentivizing Hardening
State and federal coastal management agencies should replace policies that incentivize shoreline hardening such as building seawalls with programs that give structural preference to living shoreline alternatives: oyster reef restoration, marsh sill construction, and hybrid beach-marsh complexes. Seawalls and bulkheads support 23 percent lower biodiversity and 45 percent lower organism abundance than natural shorelines.53 They do not merely fail to provide nursery habitat. They actively degrade it through wave reflection, scour, and the physical severing of the marsh-upland transition zone. Hard armoring permits should be approved only after living shoreline alternatives have been evaluated and documented as infeasible.
Along the Gulf Coast, where Louisiana loses approximately 80,000 acres of coastal wetlands annually due to levee-induced sediment starvation,54 restoration of natural sediment delivery pathways through controlled river diversions - a strategy evaluated in the Louisiana Coastal Master Plan - should be treated as a highest-priority resilience investment, not a perpetually deferred engineering study. The Coastal Wetlands Planning, Protection, and Restoration Act should be reauthorized and expanded with funding levels that reflect the scale of documented loss. The current Administration is going in exactly the opposite direction to the detriment of coastal famers and fishers.
IV. Scale the Early Warning and Buffering Infrastructure for Shellfish
Hatcheries across the Pacific coast have demonstrated that real-time water chemistry monitoring using Burke-o-Lator systems, combined with soda ash buffering and three-day oceanographic forecasting through the LiveOcean model, can recover up to 75 percent of larval losses attributable to ocean acidification events.55 Federal funding under the Bipartisan Infrastructure Law should be prioritized to subsidize Burke-o-Lator installations in hatcheries from Alaska to Maine and to extend the LiveOcean forecasting portal to the Atlantic seaboard. Co-location of eastern oyster and hard clam leases adjacent to restored eelgrass (Zostera marina) beds which draw down dissolved CO₂ through photosynthesis, biologically raising local pH provide a low-cost, ecologically synergistic buffer against acidification that the Chesapeake Bay and Gulf estuaries can deploy now.56 There just needs to be some political will and spending on people instead of wars.
V. Build a National Vibrio Early Warning System
The FDA, in partnership with NOAA and the CDC, should scale the University of Florida’s satellite-derived Vibriopredictive model into a national public health early warning system. The system should integrate real-time sea surface temperature and salinity data to map the shifting brackish salinity corridor up to one month in advance, giving shellfish growers the information to plan harvest locations safely. It should replace static, rolling five-year average risk calculations with dynamic predictive advisories, and combine satellite forecasting with rapid pathogen detection at commercial landings to identify contaminated product before it enters the raw supply chain.57 As the optimal Vibrio salinity corridor migrates upriver and northward, the geographic coverage of any effective early warning system must expand with it. We have the technology and with AI modelling the early warnings can be highly accurate.
VI. Fund Coastal Community Transition Plans
NOAA’s Sea Grant program, in partnership with state marine fisheries agencies, should develop and fund Community Climate Transition Plans for coastal fishing communities facing compounding stressors. Plans developed through participatory action research with fishing communities, integrating economic diversification pathways, targeted retraining programs, and working waterfront preservation, can bridge that gap in ways that top-down adaptation mandates cannot.
The Slow Emergency
The United States has long told itself a story about its agricultural and maritime abundance that makes it difficult to reckon with the evidence of what is being lost. The story is not false. The productivity of American coastal agriculture and fisheries is extraordinary. But it rests on a physical and ecological foundation where we have freshwater aquifers, intact salt marshes, functioning estuaries, carbonate-saturated coastal waters, and stable salinity gradients. Now, sea level rise is systematically degrading, season by season, millimeter by millimeter our coastal farms and fisheries.
The farmers watching their corn fields go white with salt are not the authors of that crisis. The watermen whose oyster reefs have eroded into tidal flat are not either. The communities in North Carolina where sorghum has replaced corn because the salt threshold arithmetic has simply made growing corn impossible, are not the problem. The Bristol Bay crab fleet that lost two seasons of commercial harvest to an acidification-driven population collapse did not cause the CO₂ that acidified the water.
But they all are paying for it. They are paying in lost income, in degraded land, in marginal profitability calculations that no longer compute, in communities that are slowly losing the economic basis for their continued existence. The question, as it always is, belongs to the people in a position to respond at scale. The science is not uncertain. The losses are documented and accelerating. The policy tools involve easements, living shorelines, early warning systems, hatchery technology, assisted marsh migration, community transition plans that already exist and have demonstrated results and could be made better with appropriate funding and new technologies.
“The sea does not care about the political calendar. It does not wait for funding cycles or legislative compromise. It moves at the pace of physics. The only question is whether policy can change and be made to move at the pace of documented losses.”
The slow emergency of sea level rise is not slow because it is not serious. It is slow because its pace allows the Politicians and top 1% to look away, to defer, to argue about whether the millimeter measurements of one decade should govern the policy decisions of the next. The 19,000 acres of Delmarva farmland already converted to salt marsh cannot be retrieved.59 The Bristol Bay crab seasons already closed cannot be fished back.60 The larvae that died in Pacific hatcheries before monitoring and buffering systems were installed cannot be recovered. The question is only how much more of the same is acceptable and what it will take for the people responsible for creating a response to save our coastal farms and fisheries to create and fund one that is proportionate to the scale of the loss.
Endnotes
1. NASA Goddard Space Flight Center / CNES (2024). Global Mean Sea Level Rise, 1993–2023. Satellite altimetry data via NOAA Laboratory for Satellite Altimetry.
2. Church, J.A. & White, N.J. (2011). Sea-level rise from the late 19th to the early 21st century. Surveys in Geophysics, 32(4–5), 585–602.
3. NOAA Tides and Currents (2024). Sea Level Trends. National Ocean Service, NOAA, Silver Spring MD. https://tidesandcurrents.noaa.gov/sltrends/
4. Elsey-Quirk, T. et al. (2022). Agricultural land loss to tidal wetland transgression exceeds forest loss in the Mid-Atlantic. Global Change Biology. The study utilized Landsat satellite imagery from 1984–2022.
5. Ibid. Marsh-farm boundary elevation data from NOAA NAVD88 datum across the Chesapeake and Delaware Bay watersheds.
6. Tully, K.L. et al. (2019). Saltwater intrusion rapidly increases CO2 and N2O emissions in coastal agricultural soils. Global Change Biology, 25(9), 3146–3157; and Weston, N.B. et al. (2011) Accelerated microbial organic matter mineralization following salt-water intrusion into tidal freshwater marsh soils. Biogeochemistry, 102, 135–151. The Nature Sustainability salt-patch mapping study covers Dorchester, Somerset, and Wicomico counties of the Delmarva Peninsula.
7. Weston, N.B. et al. (2014). The effects of varying salinity regimes on nutrient cycling in tidal freshwater and oligohaline sediments. Limnology and Oceanography, 59(3), 889–900. Economic loss estimates from: Elsey-Quirk et al. (2022) and USDA Southeast Climate Hub (2024). Identification, Mitigation, and Adaptation to Salinization on Working Lands in the U.S. Southeast.
8. USDA Southeast Climate Hub (2024). Saltwater Intrusion and Salinization on Coastal Forests and Farms. USDA, Washington DC.
9. Elsey-Quirk et al. (2022). Farmland loss by elevation: 0–5 m NAVD88 across the Chesapeake-Delaware watershed.
10. Kirwan, M.L. & Gedan, K.B. (2019). Sea-level driven land conversion and the formation of ghost forests. Nature Climate Change, 9(6), 450–457.
11. Maas, E.V. & Hoffman, G.J. (1977). Crop salt tolerance: current assessment. Journal of Irrigation and Drainage Engineering, 103(2), 115–134.
12. Rengasamy, P. (2010). Soil processes affecting crop production in salt-affected soils. Functional Plant Biology, 37(7), 613–620.
13. Tully, K.L. et al. (2019). Accelerated microbial organic matter mineralization following saltwater intrusion in coastal agricultural soils.
14. Weissman, G.S. & Tully, K.L. (2020). Saltwater intrusion affects nutrient concentrations in soil porewater and surface waters of coastal agricultural fields. Estuaries and Coasts, 43(2), 315–328.
15. Maas, E.V. & Hoffman, G.J. (1977). Corn salinity threshold of 1.7 dS/m, slope 12.0% per dS/m.
16. Ibid. Full crop tolerance table. Soybean threshold: 5.0 dS/m; wheat: 6.0 dS/m; barley: 8.0 dS/m.
17. Qadir, M. et al. (2014). Economics of salt-induced land degradation and restoration. Natural Resources Forum, 38(4), 282–295.
18. USDA Southeast Climate Hub (2024). Saltwater Intrusion: A Growing Threat to Coastal Agriculture.
19. Delta Stewardship Council (2023). Delta Plan. Sacramento, CA. California Department of Water Resources, State Water Project reports.
20. NOAA Fisheries (2023). Importance of Estuaries. National Ocean Service. At least 50% of commercially and recreationally important fish species use estuarine habitats.
21. Costanza, R. et al. (2008). The value of coastal wetlands for hurricane protection. AMBIO, 37(4), 241–248.
22. Dahl, T.E. & Stedman, S.M. (2013). Status and Trends of Wetlands in the Coastal Watersheds of the Conterminous United States 2004 to 2009. U.S. Department of the Interior, Fish and Wildlife Service, Washington, DC.
23. Ibid. Salt marshes declined by 70,000 acres between 2009 and 2019.
24. Gittman, R.K. et al. (2016). Ecological consequences of shoreline hardening: a meta-analysis. BioScience, 66(9), 763–773.
25. Ibid.
26. IPCC (2021). Climate Change 2021: The Physical Science Basis. Chapter 5: Global Carbon and Other Biogeochemical Cycles. Cambridge University Press.
27. Ekstrom, J.A. et al. (2015). Vulnerability and adaptation of US shellfisheries to ocean acidification. Nature Climate Change, 5(3), 207–214.
28. NOAA Fisheries (2024). Commercial Fisheries Statistics: Port Landings. New Bedford, Massachusetts ranked highest-value US fishing port for 22 consecutive years.
29. Rheuban, J.E. et al. (2018). Projected impacts of future climate change, ocean acidification, and management on the US Atlantic sea scallop (Placopecten magellanicus) fishery. PLOS ONE, 13(9), e0203536.
30. Barton, A. et al. (2012). The Pacific Oyster, Crassostrea gigas, shows negative correlation to naturally elevated carbon dioxide levels: implications for near-term ocean acidification effects. Limnology and Oceanography, 57(3), 698–710. Economic loss figures from NOAA OAP (2024).
31. NOAA Ocean Acidification Program (2024). Ocean Acidification’s Contribution to the Decline of Red King Crab in Bristol Bay, Alaska. NOAA, Silver Spring MD.
32. NOAA Fisheries (2024). Eastern Oyster Aquaculture Production Data. Commercial oyster industry value approximately $250M annually.
33. Sturdivant, S.K. et al. (2019). Projected sea level rise effects on estuarine habitat in the Mid-Atlantic United States. Estuaries and Coasts, 42(6), 1465–1480.
34. Oliver, J.D. (2005). Wound infections caused by Vibrio vulnificus and other marine bacteria. Epidemiology and Infection, 133(3), 383–391. V. vulnificus accounts for 95% of all US seafood-associated fatalities.
35. Horseman, T. & Suresh, P. (2011). Vibrio vulnificus: Case Report and Literature Review. Clinical Medicine and Research, 9(3–4), 220.
36. Jacobs, J.M. et al. (2015). Increased sea level and salinity as drivers of estuarine pathogen risk. Environmental Health Perspectives, 123(4), 400–407.
37. Ibid. Sea level rise modeled as a stronger driver of V. vulnificus range expansion than atmospheric warming alone.
38. Trinanes, J.A. et al. (2016). Predicting the risk of V. vulnificus infections in New England from satellite-derived sea surface temperature and salinity. GeoHealth, 1(3), 110–122.
39. Florida Department of Health (2024). Vibriosis Surveillance Report, 2022–2024. Florida DOH, Tallahassee FL.
40. FDA (2022). National Shellfish Sanitation Program: Guide for the Control of Molluscan Shellfish. 2022 Revision. US Food and Drug Administration.
41. Ibid. Vibrio Control Plan trigger conditions and harvest closure protocols.
42. Barbosa, J. & Tenreiro, R. (2011). Effect of high-pressure processing and irradiation on Vibrio parahaemolyticus and V. vulnificus in oysters. Journal of Applied Microbiology.
43. Nye, J.A. et al. (2009). Changing spatial distribution of fish stocks in relation to climate and population size on the Northeast United States continental shelf. Marine Ecology Progress Series, 393, 111–129.
44. Himes-Cornell, A. & Hoelting, K. (2015). Resilience strategies in the face of short-and long-term change: out-migration and fisheries regulation in Alaskan fishing communities. Ecology and Society, 20(2). Florida community data from NOAA Sea Grant Florida (2024).
45. Ibid.
46. Ibid.
47. USDA Southeast Climate Hub (2024). Saltwater Intrusion: A Growing Threat to Coastal Agriculture. 43 states facing some level of saltwater aquifer intrusion.
48. USDA NRCS (2024). Agricultural Conservation Easement Program. Federal Register, 89 FR 11421. https://www.nrcs.usda.gov/programs-initiatives/acep-agricultural-conservation-easement-program
49. Farmland Information Center (2024). ACEP-WRE for Landowners. American Farmland Trust, Washington DC.
50. Ibid.
51. Torio, D.D. & Chmura, G.L. (2013). Assessing coastal squeeze of tidal wetlands. Journal of Coastal Research, 29(5), 1049–1061. Nicholas Institute for Energy, Environment & Sustainability (2022). Assisted Marsh Migration: Coastal Habitats in a Changing Climate. Duke University.
52. Miller, C. (2023). Resilient Coastal Landscapes. USDA NRCS Cape May Plant Materials Center. Presentation to USETINC Annual Conference.
53. Gittman, R.K. et al. (2016). Ecological consequences of shoreline hardening: a meta-analysis. BioScience, 66(9), 763–773.
54. Louisiana Coastal Protection and Restoration Authority (2023). Louisiana’s Comprehensive Master Plan for a Sustainable Coast. CPRA, Baton Rouge LA.
55. Barton, A. et al. (2015). Impacts of coastal acidification on the Pacific Northwest shellfish industry and adaptation strategies implemented in response. Oceanography, 28(2), 146–159. Hales, B. et al. (2017). Quantification of underway pCO2 designed for high sampling rates. Marine Chemistry, 185, 51–59.
56. NOAA National Centers for Coastal Ocean Science (2024). Can Meadows of Underwater Grasses Help Mitigate the Harmful Effects of Ocean Acidification on Eastern Oysters? NCCOS, Silver Spring MD.
57. Jacobs, J.M. et al. (2015). Increased sea level and salinity as drivers of estuarine pathogen risk. Environmental Health Perspectives. University of Florida satellite Vibrio model.
58. Himes-Cornell, A. & Hoelting, K. (2015). Resilience strategies in the face of short- and long-term change. Ecology and Society.
59. Tully, K.L. et al. (2019); Elsey-Quirk et al. (2022). 19,000+ acres documented in Nature Sustainability Delmarva mapping study.
60. NOAA Fisheries (2022/2023). Bristol Bay Red King Crab Commercial Season Closure Notices. Alaska Department of Fish and Game.